V. Braga1, J.L. Braga de Aquino2, V.A. Leandro-Merhi3
1. Introduction to Science Grantee, School of Nutrition, PUC-Campinas-SP-Brazil; 2. Professor Doctor, School of Medicine, PUC-Campinas -SP-Brazil; 3. Professor Doctor, School of Nutrition, PUC-Campinas- SP-Brazil.
Corresponding Author: Vânia Ap. Leandro-Merhi, : Pontifical Catholic University of Campinas-SP-Brazil, graduate program in Health Sciences, Puc-Campinas-SP-Brazil, e-mail: valm@dglnet.com.br
Abstract
Objective: To investigate nutritional risk in hospitalized older adults with neoplasms. Methods: This cross-sectional study collected the following data from 142 older patients: gender, age, length of hospital stay (LHS), death outcome, and nutritional status indicators, such as body mass index (BMI), nutritional risk screening (NRS), subjective global assessment (SGA), and energy intake. The statistical analyses included the tests chi-square, Fisher’s exact, and Mann-Whitney’s at a significance level of 5%. Results: According to the NRS, 42.25% of the patients were at nutritional risk, and according to the SGA, 40.14% of the patients were malnourished. A total of 6.34% of the patients died. Death outcome was significantly associated with gender (p=0.0408); SGA (p=0.0301); NRS (p=0.0360); and LHS (p=0.0043). Nutritional risk (NRS) was significantly associated with SGA and BMI (p<0.0001), and LHS (p=0.0199). Conclusion: Death outcome was more common in malnourished patients, patients at nutritional risk, and patients with longer LHS. Nutritional risk was associated with malnutrition (SGA), BMI, and longer LHS. Hence, early nutritional care should be provided routinely in the hospital care of hospitalized older patients.
Key words: Nutritional risk, hospitalized older adults, neoplasms, energy intake, mortality.
Introduction
The population of older adults has risen nearly globally (1). As longevity increases, so do the demands on health providers, society, and health services (1). Some studies have found a higher mortality rate in older adults with cancer undergoing chemotherapy, especially those who are malnourished or at risk of malnutrition (2).
Low energy intake, weight loss, and reduction of body mass index can further increase the frailty and mortality of hospitalized older patients, creating a vicious circle between malnutrition and mortality (1,3). Saka et al, 2011 (4), found that malnourished patients according to the Nutritional Risk Screening (NRS) had longer hospital stays (4). Another study from Albania found that nutritional risk increased progressively in patients aged ≥ 65 years compared with those aged less than 65 years (5).
The literature attests that no single method can determine the nutritional status of hospitalized older adults. Thus, it is necessary to combine methods, using many nutritional risk indicators, such as anthropometry, subjective global assessment (SGA), NRS, and the mini nutritional assessment (MNA), among others, to diagnose an unsatisfactory nutritional status and help this type of patient to make a nutritional recovery (6, 11). Given these considerations, the objective of the present study was to investigate the nutritional risk of hospitalized older adults with neoplasms.
Cases and Methods
This cross-sectional study was conducted from August 2014 to June 2015 after approval of the local Research Ethics Committee. The study population consisted of 142 older adults being treated for neoplasms at the Hospital and Maternity Hospital Celso Pierro, of PUC-Campinas-SP-Brazil.
The following data were collected from the medical records of patients being treated for neoplasms: gender, age, length of hospital stay, and death outcome. The nutritional diagnosis was based on nutritional screening indicators, such as the Nutritional Risk Screening (NSR)11, Subjective Global Assessment (SGA) (7), and body mass index (BMI)10. Habitual energy intake in kcalories was also collected. All these data are routinely recorded in the medical records of the institution. The inclusion criteria were: patients who had undergone nutritional assessment within 24 hours of hospital admission, without end-stage disease, and aged ≥ 60 years. The exclusion criteria were: patients with incomplete nutritional status data, patients who did not undergo nutritional assessment shortly after admission, and patients admitted only for clinical investigation and tests.
The BMI of the study population was classified as recommended by Lipschitz (1994)10, who suggests the following cut-off points: underweight when BMI≤22, normal weight when 22<BMI<27, and overweight when BMI≥27.
The NRS, a method developed by Kondrup et al, 200211 classifies the nutritional risk of hospitalized older patients using the following criteria: weight loss, low energy intake, BMI loss, disease severity, and age. Patients are then classified as being or not at nutritional risk according to their score: at risk when score ≥ 3 and not at risk when score < 3)11.
The SGA model established by Detsky et al 7 investigates the following: clinical history, physical examination, weight loss in the last six months, diet changes, presence of significant gastrointestinal symptoms, assessment of functional capacity, and level of disease-related stress. These items allow the nutritional status classification of patients as follows: well-nourished when score < 7 points; mildly malnourished when 7 ≤ score ≤ 17 points; moderately malnourished when 17 < score ≤ 22 points, and severely malnourished when score > 22 points 7.
Later, habitual energy intake (HEI) was assessed by the patient’s habitual food intake history, analyzing energy intake. The percentage of HEI adequacy was estimated in relation to the energy requirement (ER) of each patient using the equation proposed by Harris & Benedict12. Energy intake was considered low when the percentage of HEI adequacy was less than 75% of the established daily energy requirement (HEI/ER<75%).
The statistical analysis included a descriptive analysis of the study variables, calculating frequency, percentage, mean, and standard deviation. The chi-square test or Fisher’s exact test when necessary was used for checking for associations or comparing proportions. The Mann-Whitney test compared continuous or ordinal measurements between two groups. The significance level was set at 5% for all tests.
Results
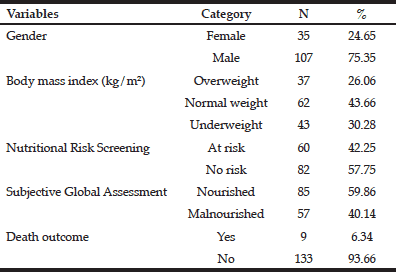
This study analyzed the variables gender, age, length of hospital stay, energy intake, death outcome, BMI, NRS, and SGA of 142 older patients with neoplasms. The mean age of the sample was 69.1±7.1 years with a mean LHS of 10.6±9.6 days. The mean percentage of HEI adequacy was 70.8±24.0% (energy intake of 1496±552.4 kcal versus an energy requirement of 2128.4±326.0 kcal). The mean BMI of the sample was 24.4±4.8 kg/m². Most patients were male (75.35%) (Table 1) and 43.66% were normal weight. According to the NRS, 42.25% of the patients were at nutritional risk, and according to the SGA, 40.14% of the patients were malnourished. A few (6.35%) patients died.
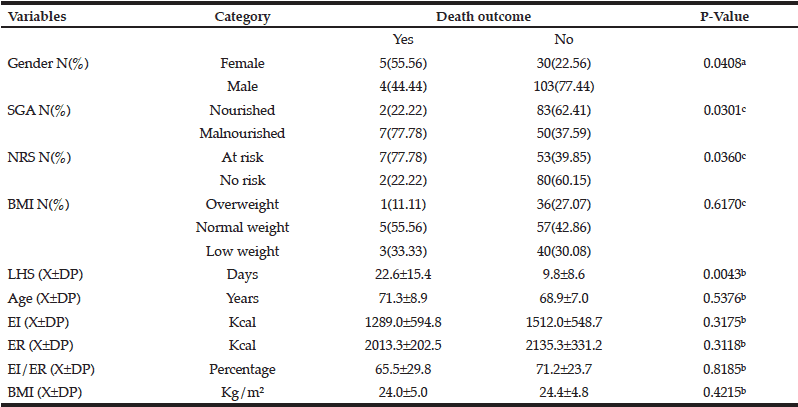
Table 2 compares the study variables and their association with death outcome, which was statistically associated with gender (p=0.0408); SGA (p=0.0301); NRS (p=0.0360); and LHS (p=0.0043). The other study variables, such as BMI, age, and EI, were not associated with death outcome.
a. Chi-square test; b. Mann-Whitney test; c. Fisher’s exact test; X±SD: mean and standard deviation; SGA: Subjective Global Assessment; NRS: Nutritional Risk Screening; LHS: Length of hospital stay; EI: Energy intake; ER: Energy requirement; %EI/ER: Percentage of energy intake in relation to the energy requirement; BMI: Body mass index.
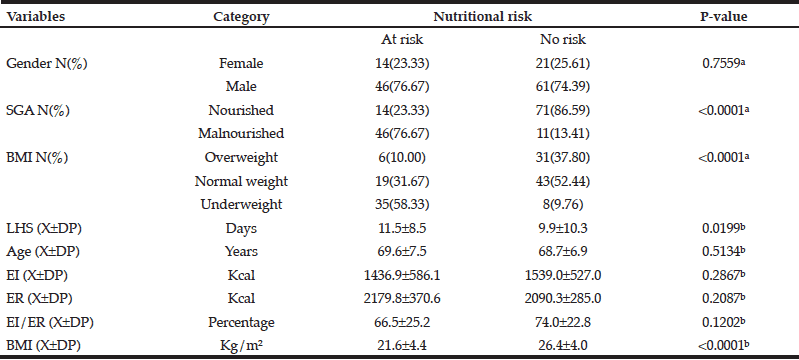
Table 3 illustrates the relationship between the study variables and nutritional risk (NRS). NRS was significantly associated with SGA (p<0.0001); with BMI by nutritional status categories (p<0.0001); and with LHS (p=0.0199). Mean BMI along with its standard deviation was also associated with nutritional risk (p<0.0001). The other variables, such as gender, age, EI, ER, and %EI/ER were not associated with nutritional risk (NRS).

Table 3 Relationship between the study variables and their association with nutritional risk according to the Nutritional Risk Screening (NRS) (N=142)
a. Chi-square test; b. Mann-Whitney test; c. X±SD: mean and standard deviation; SGA: Subjective Global Assessment; NRS: Nutritional Risk Screening; LHS: Length of hospital stay; EI: Energy intake; ER: Energy requirement; %EI/ER: Percentage of energy intake in relation to the energy requirement; BMI: Body mass index.
Discussion
The main results of this study are that nutritional risk (NRS), malnutrition (SGA), being male, and having longer hospital stays are associated with death outcome in older patients. Furthermore, nutritional risk (NRS) was significantly associated with SGA, longer hospital stays, and lower BMI. Almost one-third (30%) of the sample was underweight, 43% was normal weight, and 26% was overweight. Although most patients were normal weight according to their BMI, 26% were overweight, reflecting the impact of the nutritional transition that still occurs in Brazil (13).
Isenring et al, 2003 (14), reported that 65% of their sample was normal weight, 28% was moderately malnourished, and 7% was severely malnourished according to the SGA. The present study found that 59% of the sample was normal weight and 40% was underweight using the same method. The prevalences of normal weight, moderate malnutrition, and severe malnutrition found by another study that used the SGA to assess older cancer patients with a mean age of 70.6±7.8 years were 56.2%, 29.2%, and 14.2%, respectively15. In Chile Pañella et al, 201416, used the SGA to assess 129 patients with a mean age of 60.9±11 years and digestive tract cancer and found that 14.7% were well-nourished, 57.3% were moderately malnourished, and 27.9% were severely malnourished.
A recent study5 assessed 459 patients and found that the risk of malnutrition was higher in patients aged more than 65 years, 82.65% of the deaths involved patients aged 65 years or more, and all patients who died were at nutritional risk (5).
Another study with hospitalized older patients found a mean age of 71.7±8.2 years, mean BMI of 24.5±6.1kg/m2, mean %EI/ER of 71.6±29.9%, and mean LHS of 6.5±6.6 days8 The mean age in the present study was 69.1±7.1 years and mean %EI/ER was 70.8±24%. McLellan et al, 201017, found a mean age of 72.5±8.6 years, while LHS was around 10 days, similar to the LHS found by the present study (LHS = 10.6±9.6 days). In the present study, energy intake was not significantly associated with death outcome or nutritional risk (NRS). In another study McLellan et al, 201018, found that males had higher energy intake than females, and that patients aged 60 years or more had a mean energy intake of 1403.8±563.9 kcal. The mean energy intake found by the present study was 1496±552.4 kcal, very similar to the abovementioned study. Hospitalized older patients have unsatisfactory nutritional status, which may be related to dietary changes (19).
A Mexican study found that 50.2% of the patients were at nutritional risk (NRS) during their hospital stay and that gender, age, weight loss, low food intake, and BMI<20.5kg/m2 had the highest associations with nutritional risk.
The study data evidence that hospitalized older patients may be at nutritional risk. If diagnosed early, reversion of an inadequate nutritional status could reduce long hospitals stays, disease complications, and mortality.
Conclusion
Death outcome was more common in malnourished patients, patients at nutritional risk, and patients with longer hospital stays. Nutritional risk was associated with malnutrition (SGA), BMI, and longer hospital stays. Hence, early nutritional care should be inserted routinely in the hospital care of hospitalized older patients.
Declaration of authorship: All authors collected data, analyzed data, and wrote the article.
Conflicts of interest: The authors have no conflicts of interest.
Acknowledgments: The authors thank the Pontifical Catholic University of Campinas (PUC-Campinas) for the opportunity to conduct this study.
References
1. Agarwalla R, Saikia AM, Baruah R. Assessment of the nutritional status of elderly and its correlates. Journal of Family and Community Medicine 2015; 22(1):39-43.
2. Bourdel-Marchasson I, Blanc-Bisson C, Doussau A, Germain C, Branc JF, Dauba J, Lahmar C, Terrebonne E, Lecaille C, Ceccaldi J, Cany L, Lavau-Denes S, Houede N, Chomy F, Durrieu J, Soubeyran P, Senesse P, Chene G, Fonck M. Nutritional advice in older patients at risk of malnutrition during treatment for chemotherapy: a two-year randomized controlled trial. Plos One 2014; 9(9):1-8.
3. Silva HGV, Andrade CF, Moreira ASB. Dietary intake and nutritional status in câncer patients: comparing adults and older adults. Nutr Hosp 2014; 29(4):907-912.
4. Saka B, Ozturk GB, Uzun S, Erten N, Genc S, Karan MA, Tascioglu C, Kaysi A. Nutritional risk in hospitalized patients: impact of nutritional status on serum prealbumin. Revista de Nutrição 2011; 24(1):89-98.
5. Shpata V, Ohri I, Nurka T, Prendushi X. The prevalence and consequences of malnutrition risk in elderly albanian intensive care unit patients. Clinical Interventions in Aging 2015; 10:481-486.
6. Santos CA, Rosa COB, Ribeiro AQ, Ribeiro RCL. Patient-generated subjective global assessment and classic anthropometry: comparison between the methods in detection of malnutrition among elderly with câncer. Nutr Hosp 2015; 31(1):384-392.
7. Detsky AS, McLaughlin JR, Baker JP, Johnston N, Whittaker S, Mendelson RA, et al. What is subjective global assessment of nutritional status? J Parenter Enteral Nutr 1987; 11(1):8-13.
8. Leandro-Merhi VA, Aquino JLB, Camargo JGT. Agreement between body mass index, calf circumference, arm circumference, habitual energy intake and the MNA in hospitalized elderly. The Journal of Nutrition, Health & Aging 2012; 16(2):128-132.
9. Dudrick SJ. Nutrition Management of Geriatric Surgical Patients. Surg Clin N Am 2011; 91(4):877-896.
10. Lipschitz DA. Screening for nutritional status in the elderly. Prim Care 1994; 22(1):55-67.
11. Kondrup J, Allison SP, Elia M, Vellas B, Plauth M. ESPEN guidelines for nutrition screening 2002. Clin Nutr 2003; 22(4):415- 421.
12. Harris JA, Benedict FG. Biometric studies of basal metabolism in man. Proc Natl Acad Sci USA 1918; 4(12):370-373.
13. Batista-Filho M, Anete R. Nutritional transition in Brazil: geographic and temporal trends. Cad Saúde Pública 2003; 19(5):1445-51.
14. Isenring E, Bauer J, Capra S. The scored Patient-generated Subjective Global Assessment (PG-SGA) and its association with quality of life in ambulatory patients receiving radiotherapy. Eur J Clin Nutr 2003; 57(2):305-309.
15. Santos CA, Rosa COB, Ribeiro AQ, Ribeiro RCL. Patient-Generated Subjective Global Assessment and classic anthropometry: comparison between the methodsin detection of malnutrition among elderly with câncer. Nutr Hosp 2015; 31(1):384-392.
16. Pañella L, Jara M, Cornejo M, Lastra X, Conteras MG, Alfaro K, De La Maza MP. Relación entre estado nutricional y evolución postoperatoria, en cirurgía oncológica digestiva. Rev Med Chile 2014; 142:1398-1406.
17. Portero McLellan KC, Staudt C, Silva FRF, Bernardi JLD, Frenhani PB, Leandro-Merhi VA. The use of calf cirumference measurement as an anthropometric tool to monitor nutritional status in elderly inpatients. The Journal of Nutrition, Health & Aging 2010; 14(4):266-270.
18. McLellan KCP, Bernardi JLD, Jacob P, Soares CSR, Frenhani PB, Leandro-Merhi VA. Estado nutricional e composição corporal de pacientes hospitalizados: reflexos da transição nutricional. RBPS 2010; 23(1):25-33.
19. Gaino NM, Leandro-Merhi VA, Oliveira MRM. Idosos hospitalizados: estado nutricional, dieta, doença e tempo de internação. Rev Bras Nutr Clin 2007; 22(4):273-9.
20. Alvarez-Altamirano K, Delgadillo T, García-García A, Alatriste-Ortiz G, Fuchs-Tarlovsky V. Prevalencia de riesgo de desnutrición evaluada con NRS-2002 en población oncológica mexicana. Nutrición Hospitalaria 2014; 30(1):173-178.


