J.C. Mentes1, H. Aronow2
1. University of California Los Angeles, USA; 2. Research Scientist III, Nursing Research and Development, Cedars-Sinai Medical Center, USA
Corresponding Author: Janet C. Mentes, Associate Professor, University of California Los Angeles, USA , jmentes@sonnet.ucla.edu
J Aging Res Clin Practice 2016;inpress
Published online October 6, 2016, http://dx.doi.org/10.14283/jarcp.2016.118
Abstract
Objectives: We compared clinical data of older adults, >65 years of age who presented to a large urban ED with a primary diagnosis of dehydration, ICD code 276.5 (PD) to those with dehydration as a secondary diagnosis (SD). Design: Comparative study using a large hospital emergency room administrative database (2008-2009). Setting: Large urban hospital. Participants: 231 participants mean age 81 years, 86 with PD were matched on age, gender and ethnicity to 145 with SD. Measurements: We collected data on chief complaints, laboratory tests, medical diagnoses, and medications as listed in the database. Results: Among major diagnoses, those with SD were more likely to have an infection. A logistic regression with SD as dependent variable and using variables significant at the univariate level revealed that infections (AOR= 6.7, 95% CI 2.92, 15.08) and difficulties with activities of daily living (AOR= 2.19, 95% CI 1.02-4.66) were more likely in those presenting with SD than with PD. Patients with SD were less likely to have a diabetes diagnosis (AOR=.32, 95% CI .14, .72), have diarrhea (AOR= .50, 95% CI .22, 1.19), and present with a dry mouth (AOR= .39, 95% CI, .19, .78). Those with SD were significant more likely to be repeat ED users, have longer hospital stays and have higher hospital costs than those with PD. Conclusions: Comorbid dehydration is often obscured by the seriousness of the presenting condition in the ED. This creates a missed opportunity to educate the patients and their families about the importance of maintaining adequate hydration, which may prevent rehospitalization.
Key words: Dehydration, emergency room, aged.
Introduction
Older adults are more frequent users of emergency department (ED) services. The oldest adults, those 75 years and older, accounted for the greatest number of visits (68.2 vs 44.5 per 100 persons overall) according to the 2011 Emergency Room Summary of the National Hospital Ambulatory Medical Care Survey (1). Additionally, studies show that when compared with younger adults, older adults are more likely to be misdiagnosed, discharged to home with untreated conditions, resulting in adverse events and repeat visits to the ED (2).
Dehydration is a condition that complicates ED visits (3-5). It takes various forms, including water loss dehydration, which is a condition where a reduction in total body water occurs, and water and salt loss dehydration (6). Water loss dehydration tends to occur gradually over time (passively, i.e., from not fully replacing fluids being lost over time) versus salt and water loss dehydration, which tends to occur more abruptly (actively, i.e., from acute salt/water loss through, for example, vomiting or diarrhea) (7). Water loss dehydration appears to be the most prevalent in community dwelling older adults. In two cross-sectional community survey studies, (Third National Health & Nutrition Exam-NHANES III and the Duke University Epidemiological Study of the Elderly-EPSE), that included the collection of serum osmolality values and an analysis that controlled for the effect of elevated glucose levels, Stookey and colleagues (8,9) demonstrated almost identical prevalence rates of mild (40%) and overt dehydration (20%) among community dwelling older adults. Likewise in residents of nursing homes, dehydration is a common condition requiring transfer to the emergency department (5). Highlighting the seriousness of this condition, of older Medicare patients hospitalized with a diagnosis of dehydration, 18% died within 30 days and approximately half died within a year of their dehydration diagnosis (10). More recently, in a sample of older veterans hospitalized with a diagnosis of dehydration (ICD-9 276.5), 13.8% and 29% died within 30 days and six months respectively, which was significantly different than hospitalized older veterans without dehydration (11). One of the difficulties of treating older adults in the ED is that commonly, an insidious and deadly condition such as dehydration may be overlooked or minimized in the diagnostic equation. Older adults often present to the ED with exacerbations of chronic diseases or acute infections that coexist with dehydration which may complicate treatment. As examples, hospitalizations for urinary tract infections and septicemia in adults 85+ increased by 56% and 85% respectively between 2000-2010 (12). Both of these conditions are linked to hydration status (11).
Dehydration is also costly. In a recent review, Frangeskou and colleagues (13) found that dehydration in the hospitalized patient increased costs by 7-8.5%. Dehydration is also designated as one of 13 ambulatory-care sensitive conditions (ACSC), a condition that should be prevented by good ambulatory care. However, in 2012, 50% of the 172,520 admissions of persons with a primary diagnosis of dehydration 50% were older than 65 years at a cost of over 3 billion dollars (13). In addition, almost 1 in 10 (9%) of all hospitalizations in persons over 65 in 2012 had dehydration as a secondary diagnosis, which is documented to contribute to the disease burden of common illnesses such as heart disease, diabetes, renal failure, stroke, pneumonia, and urinary tract infections (10,14-16). Since 2007 the number of older adults aged 75 years and older who have been admitted with a primary diagnosis of dehydration has remained static at between 75-77/10,000 admissions, demonstrating the difficulty with managing hydration in older adults (16-18). Although there are estimates for the prevalence of dehydration as a complicating secondary diagnosis; it is likely that many cases of secondary diagnosis are missed as the older patient presented to the ED with more serious conditions that were likely exacerbated by inadequate hydration prior to admission (19).
In light of the impact of dehydration on health outcomes and costs, the purpose of this secondary data analysis was to improve understanding of how best to treat patients with dehydration and prevent future hospitalizations by comparing and contrasting the admission data of older adults, >65 years of age who presented to a large urban ED with dehydration (ICD-9 276.5) as a primary diagnosis (PD) and those presenting with dehydration as a secondary diagnosis (SD). Characterizing these different presentations can provide meaningful information for individually tailored interventions to minimize dehydration in this population.
Methods
We employed a comparative study design using electronic ED administrative data and ED medical records between July 1, 2008 and June 30, 2009 for a major medical center in Los Angeles. This medical center had over 15,000 ED contacts in persons 65 years old and over during this one year time period. We received human subject approval from the respective IRBs of the university and medical center.
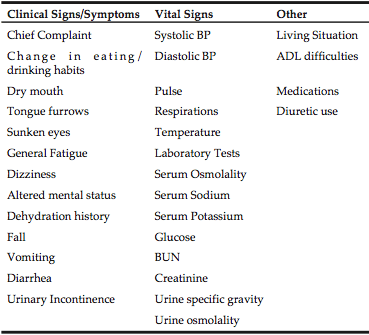
Procedure. We used an administrative database of adults, aged 65 and older that presented to the ED with a diagnosis of dehydration, as a primary or any diagnosis for that contact. To control for potential confounding demographic variables we included all primary dehydration cases (n=86) and matched them with secondary cases based on age, gender, and ethnicity. We attempted to match every participant with primary dehydration to 2 participants with secondary dehydration; each participant had at least one match to a participant with secondary dehydration. After identifying the cases of primary dehydration (n=86), a trained research assistant matched the primary cases to secondary cases (n=145) ensuring that there were no duplicates in the data set; ie the same person presenting at one time point in the specified period with dehydration as a primary diagnosis and with dehydration as a secondary diagnosis at another time point. After this participant list was generated, a chart review of the electronic ED record was conducted to collect specific clinical information, including laboratory tests, medications, presenting complaint, and clinical signs and symptoms of dehydration (Table 1). Data were then de-identified prior to analyses.
Data Preparation and Analysis
The de-identified administrative data set was prepared in an excel spreadsheet. One RA accomplished the data compilation with data checks completed by the PI. The data were then imported into an SPSS 17.0 file for analysis.
Data analysis was conducted using Student t-tests for continuous data and chi square tests for dichotomous data to evaluate the differences between the participants with a diagnosis of primary versus secondary dehydration. Independent t-tests were used even though the sample was selected based on matched participants because the purpose of matching participants was to control for covariates (gender, age, and ethnicity) that might obscure meaningful relationships. A logistic regression with primary or secondary dehydration as the dependent variable was conducted with the covariates found significant at the p< 0.15 level in the unadjusted analyses using Pearson’s chi square statistic.
Findings
Demographic Data
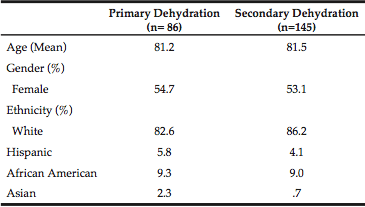
The sample for this project included 86 participants who presented with PD to the ED matched with 145 participants who had SD (total n=231). On average participants were 81 years old, about half female and predominately white. Age, gender and ethnicity were evenly distributed between the groups as a function of the matching process (see Table 2).
All comparisons nonsignificant
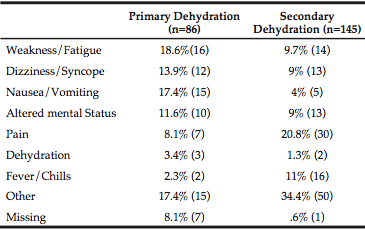
We found differences in chief complaints between the groups with individuals who had dehydration as a primary diagnosis presenting with more generalized symptoms or geriatric syndromes of weakness, dizziness, nausea/vomiting and altered mental status than those individuals with secondary dehydration. Persons with a secondary diagnosis of dehydration were more likely to present with pain or fever/chills (Table 3).
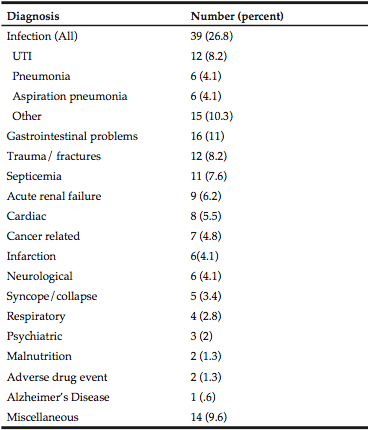
Table 4 lists the primary diagnoses of persons with dehydration as a secondary diagnosis. The top five diagnoses were: any infection (26.8%), gastrointestinal problems (11%), trauma/fractures (8.2%) septicemia (7.6%), and acute renal failure (6.2%).
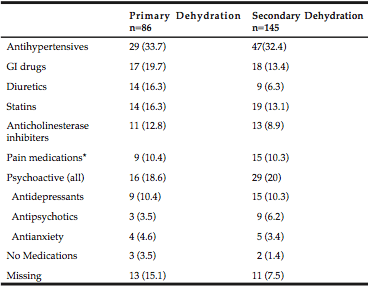
The most commonly prescribed medications for persons with primary and secondary dehydration are presented in Table 5. Most common classes of drugs; those for hypertension, lipid lowering, gastrointestinal problems, and pain medications were similar whether the individual presented with primary or secondary dehydration. However a striking difference was observed in the use of diuretics, which was higher in persons with primary dehydration (16.3% vs 6.3%, p=.007).
Note. *Excludes aspirin and acetaminophen
Note. OR=Odds Ratio, CI=Confidence Interval. * Backward Logistic Regression.
Clinical Differences
The assessment for dehydration in the ED was difficult to explore because the data included in the medical record was limited, specifically laboratory studies. Although vital signs were well documented, of the 231 persons included in this study only 1 had a urine or serum osmolality and 132 had a urine specific gravity documented in the medical record. Serum sodium was collected in 78/ 86 (90.6%) persons with PD and 141/145 (97%) of those with SD and was significantly higher in persons with SD (141.4 meq/L vs 139.9 meq/L, p<.05) than those with PD. No other laboratory measurements specifically BUN creatinine ratio or urine specific gravity were significantly different between the groups.
Of the vital signs, respirations were the only sign significantly different between the groups, with persons with SD having slightly higher respirations (p<.05). Other clinical signs and symptoms of dehydration were not consistently documented in the ED record, however for those individuals with documentation, there were some significant differences between persons presenting with PD versus SD.
Unadjusted comparisons of 21 variables (clinical signs, medical diagnoses, medications, laboratory tests) shown to be related to dehydration in the literature showed that common chronic diseases in older persons, such as cancer, cardiac disease, dementia, and chronic renal disease were not significantly different between the PD and SD (data not shown). However, 9 variables were significant at p< .15 level, including: activities of daily living (ADL) difficulties, presence of any infection, altered mental status, diagnosis of diabetes, diarrhea, diuretic use, presence of dry mouth, presence of urinary tract infection (UTI) and vomiting (Table 6). These covariates were considered for inclusion in the adjusted multivariate analysis (See Table 6). Although not statistically significant in unadjusted analysis, urine specific gravity was included in the logistic regression models because it was the most frequently used laboratory test to ascertain hydration status.
A backward stepwise logistic regression was performed with the 10 identified variables with primary versus secondary dehydration as the dependent variable (Table 6). Variables included in this model were the presence of any infection, dry mouth, diagnosis of diabetes, change in ADLs and diarrhea The model had a significant omnibus test of model coefficients, p<.001 and Hosmer and Lemeshow test , p=.35. This model predicted secondary dehydration 90% of the time, whereas the overall percentage of correct classification was 74%.
In this model the presence of an infection was between 6 to 7 times more likely in an older patient with dehydration as a secondary diagnosis than in a patient with primary diagnosis of dehydration. Conversely, for the clinical sign of dry mouth or a diagnosis of diabetes, a patient with secondary dehydration was 60%, and 78% less likely to present with these conditions than one with primary dehydration, respectively. Difficulties with ADLs were twice as likely in an individual who presented with SD versus one who presented with PD.
Hospital Utilization
In terms of the ED experience for older individuals with dehydration, the time spent in the ED and number of ED visits per year for dehydration did not significantly differ. However, persons with SD were more likely to be a repeat ED user for any cause than those with primary dehydration (χ2 =4.52, p=0.03). Hospital utilization and costs also were significantly different for individuals with primary and secondary dehydration with individuals with secondary dehydration having significantly longer hospital stays, (8.0 days vs 4.69 days, p<.000) at significantly increased costs ($23,356.79 vs $12, 094.90, p<.000) than those individuals with primary dehydration.
Discussion
Many older persons present with dehydration as a complicating feature to their ED contact. This paper explored the differences between older individuals presenting with dehydration as a primary diagnosis and those who presented with dehydration as a secondary diagnosis. What is evident from this study is that older persons presenting with SD versus PD have different patterns of chief complaints. Those with SD presented with chief complaints of fever/chills and pain with a high likelihood of the presence of an infection and difficulties with daily function. Persons with SD were less likely to have more generalized symptoms typical of the geriatric syndromes of fatigue, weakness, dizziness, and altered mental status and less likely to present with more classic signs of dehydration such as dry mouth and diarrhea. They were also less likely to be diabetic than those presenting with PD. In addition persons with SD were more likely to be a repeat ED user at a greater cost to the health care system, making it important to further explore the contribution of dehydration to repeat hospitalizations and potential treatment of dehydration to prevent readmissions.
The findings suggest that older individuals presenting to the ED with a primary diagnosis of dehydration have identifiable brief onset conditions that predispose them to dehydration, such as vomiting and diarrhea or sequela of diabetes. These conditions actively dehydrate the individual and are more commonly accepted as causes of dehydration. On the other hand individuals presenting with secondary dehydration present with a chronic illness picture that is complicated by decreased functional ability, and infections. Although we cannot be sure of the temporal issues involved with dehydration as a complicating diagnosis, this analysis lends support to the likelihood that those elders presenting with secondary dehydration most likely suffer from passive water loss dehydration that occurs little by little over time, possibly exacerbated by inability to procure adequate fluids due to functional impairment. The distinction between active and passive dehydration is important because recent research has raised the question of which hydration biomarkers are specific to the mechanism (active vs passive) of dehydration (7, 20, 21). In younger adults, the urine biomarkers of specific gravity and urine osmolality are more sensitive to passive dehydration (7, 21) and are responsive to changes in water intake over 24 hours (22). It is not known if this is true for older adults and may not be practical for ED practice given that serial measurements are necessary. On the other hand, serum and salivary osmolality have been documented as more sensitive to active dehydration in younger adults (7, 21). Fortes and colleagues (20) recently reported that for single laboratory tests for dehydration in adults > 60 years seen in the ED or admitted to an acute medical care unit, salivary osmolality offered the best diagnostic accuracy of both active and passive dehydration.
There are several limitations to this study. It was a cross-sectional study of secondary administrative and chart data, which was limited by the constraints of the documentation. As such, no causal relationships could be determined and the temporal aspects of whether suboptimal hydration occurred prior to or as a consequence of chronic illness could not be determined. Additionally, missing data, specifically the lack of uniform laboratory information for all participants limited the ability to compare the participants based on whether they presented with PD or SD. However, several of the findings are supported by other investigations that reported that diabetes (23), difficulties with ADLs (11) and dry mouth/tongue (24, 25) have been associated with dehydration, although the distinction between active or passive dehydration was not specified.
It is important to note that the role that dehydration plays as a co-morbid condition is often obscured by the seriousness of the presenting condition, which is often an infection. This likely represents a missed opportunity for health care providers in all settings to educate patients and families about the importance of adequate daily hydration, including how much, what type of fluids taking into consideration the patient’s activity level and any restrictions related to the management older persons who are vulnerable to dehydration due to chronic illness. This is one strategy for possibly preventing unnecessary and unwanted hospitalizations.
Conflict of interest: None
References
1. Centers for Disease Control, National Center for Health Statistics (2011). National Hospital Ambulatory Medical Care Survey: 2011 Emergency Department Summary. retrieved from: http://www.cdc.gov/nchs/data/ahcd/nhamcs_emergency/2011_ed_web_tables.pdf
2. McCusker, J., Cardin, S., Bellavance, F., & Belzile,E. Return to the emergencey department among elders: Patterns and predictors. Academic Emergency Medicine, 2000;7, 249-259.
3. Gordon, J.A., An, L.C., Hayward, R.A. & Williams, B.C. Initial emergency department diagnosis and return visits: risk versus perception. Ann Emerg Med 1998;32, 569-73
4. Bennett, J.A., Thomas, V. & Riegel, B. Unrecognized chronic dehydration in older adults: examining prevalence rate and risk factors. J Gerontol Nurs 2004;30, 22-8.
5. Hsiao, CJ, & Hing, E. Emergency department visits and resulting hospitalizations by elderly nursing home residents 2001-2008. Research on Aging, 2014;36, 207-227. doi: 10.1177/0164027512473488.
6. Thomas, DR., Cote, TR, Lawhorne, L., Levenson, SA, Rubenstein, LZ, Smith, DA, Stefanacci, RG, Tangalos, EG, & Morley, JE. Understanding clinical dehydration and its treatment. Journal of American Medical Directors Association, 2008;4,292-301. doi: 10.1016/j.jamda. 2008.03.006.
7. Munoz, CX., Johnson, EC, DeMartini, JK, Huggins, RA, McKenzie, AL, Casa, DJ, Maresh, CM, & Armstrong, LE. Assessment of hydration biomarkers including salivary osmolality during passive and active dehydration. European Journal of Clinical Nutrition, 2013;67, 1257-1263. Doi: 10.1038/ejcn.2013.195.
8. Stookey, J.D. (2005): High prevalence of plasma hypertonicity among community-dwelling older adults: results from NHANES III. J Am Diet Assoc 2005;105, 1231-9.
9. Stookey, J.D., Pieper, C.F. & Cohen, H.J. Is the prevalence of dehydration among community-dwelling older adults really low? Informing current debate over the fluid recommendation for adults aged 70+years. Public Health Nutr 2005;8, 1275-85.
10. Warren, J.L., Bacon, W.E., Harris, T., McBean, A.M., Foley, D.J. & Phillips, C. The burden and outcomes associated with dehydration among US elderly, 1991. Am J Public Health 1994;84, 1265-9.
11. Wakefield, B., Mentes, J., Holman, J. Culp, K. Postadmission dehydration: Risk factors, indicators and outcomes. Rehabilitation Nursing, 2009;34 (5), 209-216
12. Levant, S., Chari, K., & DeFrances, CJ. Hospitalizations for patients aged 85 and over in the United States, 2000-2012, NCHS brief, 2015;no. 182. Hyattsville, MD: National Center for Health Statistics.
13. Frangeskou, M., Lopez-Valcarcel, B., & Serra-Majem, L. Dehydration in the elderly: A review focused on economic burden. The Journal of Nutrition, Health & Aging, 2015;19, 619-627.
14. Liu, CH, Lin, SC, Lin, JR, Yang, JT, Chang, YJ, Chang, CH, Chang, TY….Lee, TH. Dehydration is an independent predictor of discharge outcome and admission cost in acute ischaemic stroke. European Journal of Neurology, 2014;21, 1184-1191. doi: 10.1111/ene.12452
15. Rowat, A., Graham, C., & Dennis, M. Dehydration in hospital-admitted stroke patients. Detection, frequency and assessment. Stroke, 2012;43, 857-859. Doi: 10.1161/STROKEEAHA.111640821.
16. Xiao, H., Barber, J, & Campbell, ES. Economic burden of dehydration among hospitalized elderly patients. American Journal of Health-System Pharmacy, 2004;61, 2534-2540.
17. Agency for Healthcare Research & Quality. Prevention quality indicators comparative data Version 3.1 March 12, 2007. Retrieved from http://www.qualityindicators.ahrq.gov/Downloads/Modules/PQI/V31/pqi_comparative_v31.pdf.
18. Agency for Healthcare Research & Quality. Prevention quality indicators benchmark data tables Version 5 March 2015. Retrieved from http://www.qualityindicators.ahrq.gov/Downloads/Modules/PQI/V50/Version_50_Benchmark_Tables_PQI.pdf.
19. Mentes, JC. The complexities of hydration issues in the elderly. Nutrition Today, 2013;48 (4S), S10-S12.
20. Fortes, MB., Owen, JA., Paymond-Baker, P., Bishop, C., Elghenzai, S., Oliver, SJ, & Walsh, NP. Is this patient dehydrated? Diagnostic accuracy of hydration assessment using physical signs, urine , and saliva markers. Journal of the American Medical Directors Association, 2015;16, 221-228. doi:10.1016/j.jamda2014.09.012.
21. Munoz, CX, McKenzie, AL, & Armstrong, LE. Optimal hydration biomarkers: Consideration of daily activities. Obesity Facts, 2014;7(suppl 2), 13-18. doi:10.1159/000360655.
22. Perrier, E., Demazieres, A., Girard, N., Pross, N., Osbild, D., Metzger, D., Guelinckx, I., & Klein, A. Circadian variation and responsiveness of hydration biomarkers to changes in daily water intake. European Journal of Applied Physiology, 2013;113, 2143-2151. doi: 10.1007/s00421-013-2649-0.
23. Hooper, L., Bunn, D., Downing, A., Jimoh, F., Groves, J., Free, C…Shepstone, L. Which frail older people are dehydrated? The UK DRIE Study. Journal of Gerontology: Medical Sciences. Epub ahead of print. 2015;doi:10.1093/gerona/glv205
24. Gross, CR., Lindquist, RD, Wooley, AC, Granieri, R., Allard, K., &Webster, B. (1992). Clincal indicators of dehydration severity in elderly patients. Jouranl of Emergency Medicine, 1992;10 (3), 267-274.
25. Vivanti, A., Harvey, K, & Ash, S. Developing a quick and practical screen to improve the identification of poor hydration in geriatric and rehabilitative care. Archives of Gerontology and Geriatrics, 2010;50, 156-164. doi: 10.1016/j.archger.2009.03.003.

