M. Lombardo1, R. Magarotto1, F. Marinelli1, E. Padua1,3, M. Caprio1, G.Annino3, A. Bellia1,2, F. Iellamo3,4
1. Human Nutrition Unit, San Raffaele Rome Open University, Italy; 2. Department of Systems Medicine, Faculty of Medicine and Surgery, Tor Vergata University, Rome, Italy; 3. Dep. Clinical Science and Translational Medicine, University Tor Vergata; 4. IRCCS San Raffaele Pisana, Roma.
Corresponding Author: Mauro Lombardo, MD, San Raffaele Rome Open University, Via di Val Cannuta, 247, 00166 Roma, Italy. E-mail: mauro.lombardo@unisanraffaele.gov.it
J Aging Res Clin Practice 2017;inpress
Published online January 5, 2017, http://dx.doi.org/10.14283/jarcp.2017.1
Abstract
Objectives: This retrospective clinical study was intended to assess the ideal number of calories in the Mediterranean-style diet (MD) required for maximum weight reduction through a greater decrease in fat mass (FM) and maintenance of fat-free mass (FFM). Methods: We analysed the data of 90 non-smoking subjects (56 females, age = 32.5 ± 9.6 years, BMI = 28.3 ± 5.4 kg/m2, data as mean ± SD). The participants underwent two-month individualised MDs with similar macronutrient composition (55% carbohydrate, 30% fat, 15% protein and fibre > 30 g) but different amounts of energy, which varied daily from 374 kcal to 1305 kcal compared with the total energy expenditure measured by metabolic Holter. The sample was divided into nine groups of 10 subjects in order to establish the amount of energy restriction that was most effective in terms of achieving fat loss and maintaining muscle mass. Results: All subject groups had significant improvements in body composition parameters (weight loss = 2.7 ± 1.8 kg, FM loss = 2.2 ± 1.2 kg and FFM loss = 0.5 ± 1.3 kg). Differences between the nine groups were not significant but higher FM loss was observed in groups one, three, six and eight. Groups one and four had the highest FFM increase and groups two, three and eight had the highest FFM loss. Conclusions: These data suggest that increasing the amount of energy restriction in a low-calorie MD might be useless in terms of obtaining a higher FM loss but a lower restriction could be more effective for maintaining FFM.
Key words: Energy restriction, Mediterranean-style diet, body composition, obesity.
Abbreviations: MD: Mediterranean-style diet; FM: fat mass; FFM:f at-free mass; WL: weight loss; REE: resting energy expenditure; VLCD: very low calorie diet; %FML: % fat mass lost; %FFML: % fat-free mass lost; FFML: fat-free mass lost; FML: fat mass lost.
Background
For successful long-term weight loss (WL) the focus should be on achieving the best body composition for maintaining health rather than merely the loss of body weight (BW) (1). Since FM is the most metabolically dangerous tissue type, it is a more meaningful measure of health risk (2). A decrease in weight during a diet should aim at the slightest reduction of FFM, trying to shift the deficit towards fat, particularly visceral fat (3). A variable amount of FFM is often lost in combination with fat loss, and the aim should be to keep this loss to a minimum and to preserve resting energy expenditure (REE). Weight loss-associated adaptations in REE may impair weight loss and contribute to weight regain. In contrast to weight-stable subjects, weight regainers showed a reduced REE adjusted for changes in organ and tissue masses after weight loss (4).
Promoting eating habits consistent with Mediterranean Diet (MD) patterns may be a useful factor in efforts to fight obesity. High MD adherence has been associated with a significantly lower chance of becoming obese among overweight subjects, with stronger associations after adjustment for underreporting of dietary data (5).
Reduced-calorie diets result in clinically meaningful weight loss regardless of which macronutrients they emphasise (6). In a recent trial (7) subjects lost more FM than FFM after consumption of different diets, with no differences in changes in body composition, abdominal fat, or hepatic fat between assigned macronutrient amounts. Thus a combination of diet and exercise provides greater improvement in physical function than either intervention alone (8).
The degree of caloric restriction, exercise and rate of weight loss influences the percentage of fat-free mass lost (%FFML). Comparison diets with similar nutrient composition show that the degree of caloric restriction impacts on %FFML, at least in the short term (9). A very low calorie diet (VLCD) is a diet with extremely low daily food energy consumption (800 kilocalories per day or fewer). VLCD provides quite rapid weight loss and higher loss of LBM. An accurate assessment of EE is necessary to determine caloric needs and to provide optimal nutrition support for in-patients, as well as nutrition counselling for outpatients (10).
This retrospective clinical study was intended to assess in the short term the ideal reduction of calories in subjects following an MD to obtain the maximum weight reduction through a greater decrease in FM and maintenance of FFM.
Subjects and methods
All 90 subjects were adult Caucasians and provided written informed consent to participate. The investigation was conducted in accordance with the Declaration of Helsinki. Exclusion criteria were as follows: age 55 years; pregnancy or nursing; any lifestyle treatment in the year before; alcoholism; diabetes mellitus; chronic kidney disease; glucocorticoids, oestrogens and anti-convulsant therapies; history of cardiovascular, neoplastic or other systemic diseases (both chronic and acute). All subjects underwent thorough medical examination and subsequent food history, physical examination and evaluation of body composition. Weight and height were measured after subjects fasted overnight and were wearing only underwear. Body composition: fat mass (FM), fat-free mass (FFM) and hydration status (TBW) were recorded by the BIA Tanita BC-420 MA, a validated instrument with DXA [11], which measures values from a standing position and without the use of electrodes to within 100 grams.
The same protocol with detection of the above information was carried out two months later. Patients were required to observe the following guidelines before body composition analysis: at least three hours after awakening and the beginning of the normal daily activities; three hours or more after meals and not eating or drinking too much the day before the measurement; 12 hours or more after a hard workout; urinating before the measurement; avoiding alcohol 12 hours before the visit and avoiding menstruation.
The total energy expenditure was measured by a multisensory armband (SenseWear Pro2 Armband, Bodymedia Inc., Pittsburgh, PA, USA) worn on the back of the upper right arm that recorded data for at least 48 hours in a free-living context. The measured values are represented by TEE (total energy expenditure), the steps taken, the energy expenditure during exercise and daily METs. All subjects were also asked to maintain the same lifestyle and sporting activity consistently for the duration of the study.
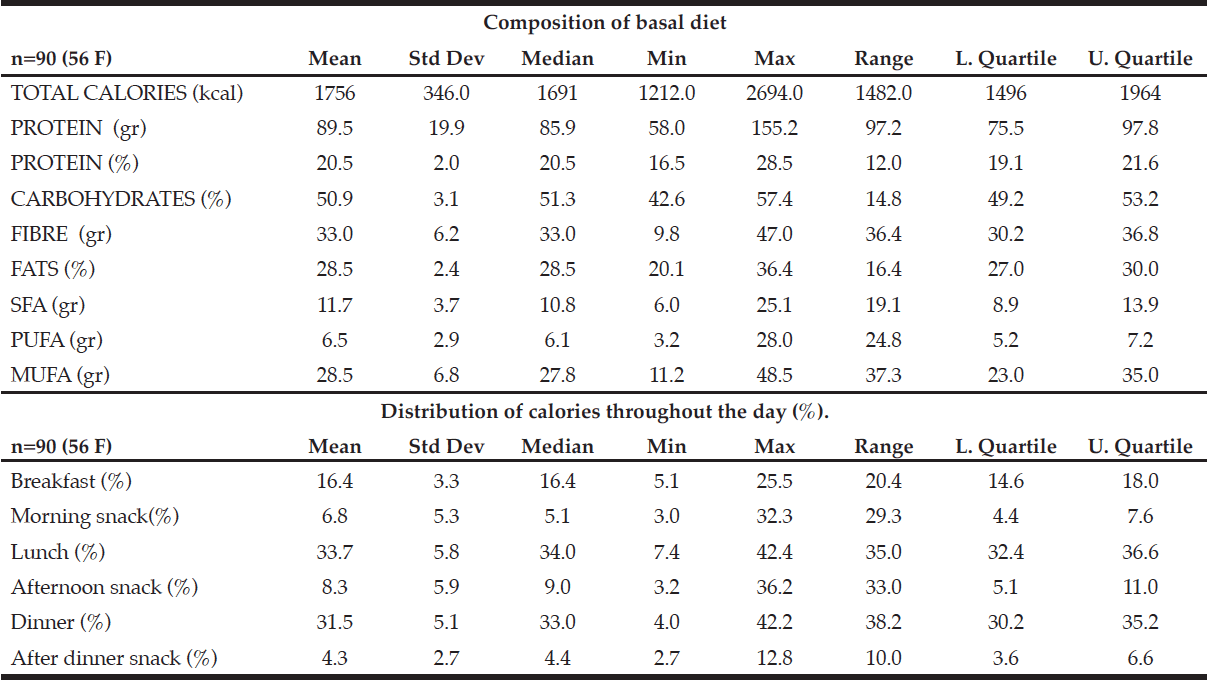
All participants were placed on a two-month hypocaloric nutritionally balanced MD tailored to the individual. The nutritional patterns of the MD and the distribution of the daily food ration are shown in Table 1. A diet with a higher number of calories in the first part of the day was elaborated in order to establish a greater reduction in fat mass as we demonstrated before (12). The main features of MD are as follows (13): eating primarily plant-based foods, such as fruits and vegetables, whole grains, legumes, and nuts; replacing butter with healthy fats such as olive oil; using herbs and spices instead of salt to flavour foods; limiting red meat to no more than a few times a month; and eating fish and poultry at least twice a week. Nutritional intakes were divided into three main meals and two or three snacks. Twice a month patients met a dietitian for a nutritional rehabilitation programmed designed to improve and promote change in eating habits and consisting of individual sessions (dietary assessment, evaluation of nutrient intake and adequacy, nutritional status, anthropometric data, eating patterns, readiness to adopt change). Patients were required to complete a three-day diet diary at the beginning of the study and then weekly throughout the follow-up. Diaries included one weekend day. In order to achieve a more favourable body composition regarding total fat and muscle mass, we recommended a combination diet with endurance and strength training tailored to the individual by a personal trainer (14). The sample was divided into nine homogeneous groups of 10 subjects in relation to the difference% (Δkcal%) between caloric intake and TEE.
SFA: saturated fatty acids. MUFA: monounsaturated fatty acids. PUFA: polyunsaturated fatty acids
Statistical analyses
The data were analysed with SOFA Statistics ver. 1.4.2 open source software. Results for descriptive statistics were expressed as mean ± standard deviation or median (range). Statistical comparisons of continuous variables among the groups were performed with one-way ANOVA. A P-value of <0.05 was considered statistically significant.
Results
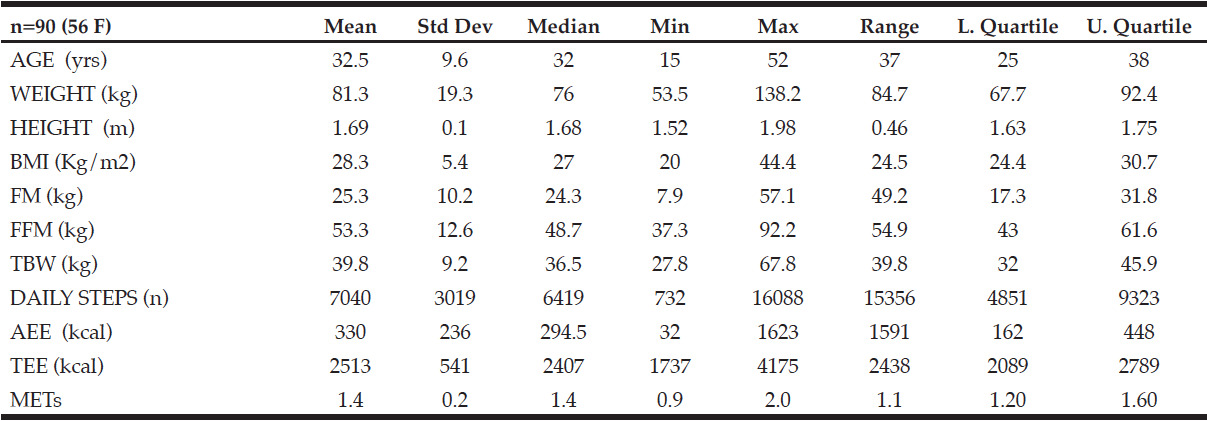
Baseline characteristics of the 90 (56 women, age 32 ± 10 years) participants recruited to the study are shown in Table 2. Subjects showed an average BMI of 28.3 ± 5.4 kg / m2 and FM of 25.3 ± 10.2 kg (38.3%), FFM 53.3 ± 12.6 Kg (61.7%) and TBW of 39.8 ± 9.2 kg (41.3%). The sample at the beginning of the study had a mean total energy expenditure of 2513 ± 541 kcal, an active energy expenditure of 330 ± 236 Kcal and daily average METs of 1.4 ± 0.2. The subjects wore the instrument metabolic Holter SenseWear® Armband for an average 2.13 ± 1.2 days continuously, performing a total number of steps of 7040 ± 3019. Correlations between %FML and calorie restriction (A), daily METs (B), diet protein (gr) for weight (kg) (C), and daily steps (D) are shown in Figure 1. Significant correlations were found for %FL and daily METs (p= 0.037) and diet protein (p= 0.017). Figure 2 shows the correlation between %FFML values and calorie restriction (A), daily METs (B), protein (gr) diet for weight (kg) (C), and daily steps (D). No statistical correlation was found between these values.
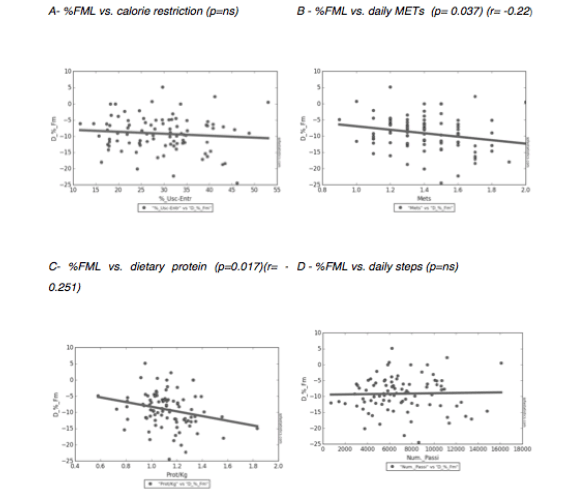
Figure 1
Correlation between fat mass loss (%FML) and calorie restriction (A), daily METs (B), diet protein (gr) for weight (kg) (C), and daily steps (D)
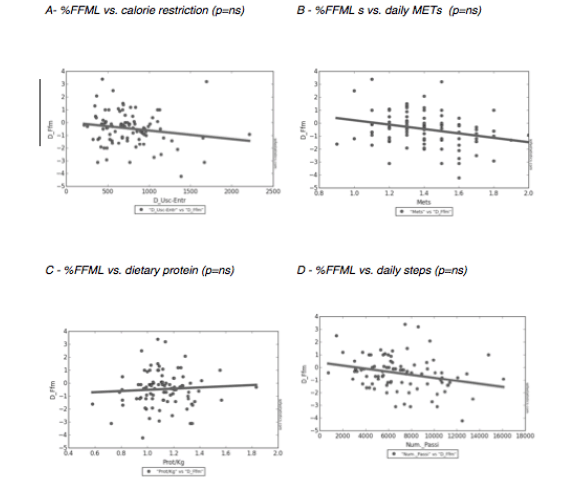
Figure 2
Correlation between fat-free mass loss (%FFML) values and calorie restriction (A), daily METs (B), diet protein (gr) for weight (kg) (C), and daily steps (D)
There were no significant nutritional differences between the nine groups except diet’s calories. Group nine had the highest amount of dietary restriction (1305kcal) and group one had the lowest (374kcal). Dietary features, energy expenditure and body composition of the nine groups are shown in Table 3. Groups 8 and 9 had the highest energy expenditure for sporting activity and higher daily average METs.
n: number of subjects ; BMI: body mass index; FM: fat mass; FFM: fat-free mass; TBW: Total body water; AEE (active energy expenditure); TEE: total energy expenditure; METs: Daily metabolic equivalent task
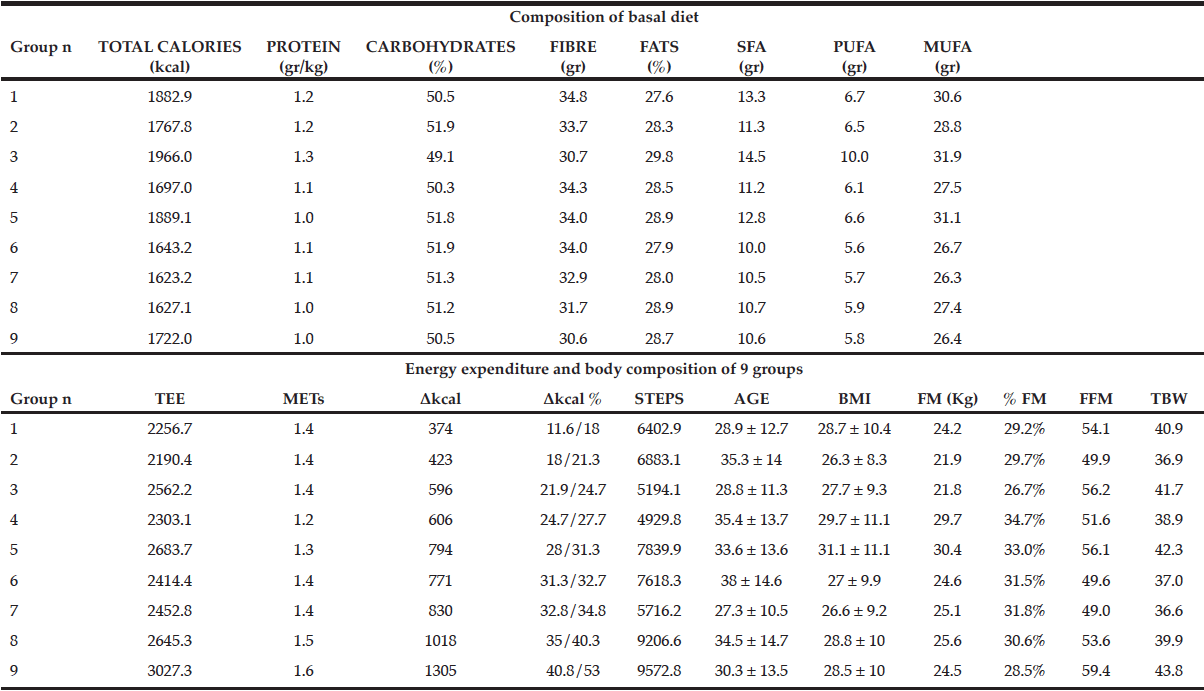
Table 3
Difference between diet features, body composition and energy expenditure parameters between the nine groups
Data are mean values. Every group is formed by 10 subjects. TEE: total energy expenditure AEE (active energy expenditure); METs: daily metabolic equivalent task; STEPS: daily steps; BMI: body mass index; FM: fat mass; %FM: % fat mass, FFM: fat-free mass; TBW: total body water.
The differences for all subjects between the values at the beginning (T0) and end of the study (T1) are shown in Table 4. All subjects’ results returned the following changes (Δ): Δweight equal to 2.68 ± 1.79 kg, ΔBMI equal to 0.93 ± 0.6 kg / m2, %FML equal to 2.2 ± 1.2 kg, FFML equal to 0.46 ± 1.3 kg and TBWL 0.5 ± 0.9 kg. Table 5 shows differences in the average kg of fat mass between the start and end of the study sample for the nine groups.
Data are mean values. n: number of subjects; FM: fat mass; FFM: fat-free mass; TBW: total body water
Δkcal: mean difference in Kcal between caloric intake and energy expenditure; Δkcal%: % difference between caloric intake and energy expenditure (minimum and maximum value of the group); ΔWEIGHT: mean difference in weight in Kg between the start and end of study; ΔBMI: mean difference in BMI between the start and end of study; %FML: mean difference of % fat mass between the start and end of study; ΔTBW: mean difference in total body water (TBW); ΔFFM: mean FFM difference in Kg between the start and end of the study. There is no statistically significant difference between the groups.
A significant decrease of FM was observed in all groups with different numbers of calories and energy expenditure reduction; the groups with greater restriction, such as eight and nine, had decreases comparable to groups with less restriction, such as one and three. Furthermore, the analysis of variance between groups (ANOVA) did not find any significant difference.
Discussion
Our findings suggest that different rates of energy restriction result in similar body composition variation after two months of MD in overweight or obese individuals (15). Common findings suggest the necessity for acute energetic imbalance; in our results there appears to be no relationship between an higher energy deprivation and better body composition results after MD. Our data confirm the idea of a more complex network of factors that influence overall body composition and health issues for adults (16).
Typical weight loss rules assert that a energy deficit of 7700 kcal is required to lose 1 kg of body weight, or equivalently 32.2 MJ per kg. However, it has been pointed out that FFM is lost in concert with FM during WL and thus it is now generally accepted that these rules overestimates FML%. A more recent rule on expected fat-free mass (FFM) states that approximately one-quarter of weight loss will be FFM (i.e. ΔFFM/ΔWeight = ~0.25), with the remaining three-quarters being FM (17). The ideal number of calories for maximising FM loss while preserving FFM has not been established in previous study (5).
All nine groups achieved weight reductions between 2 and 3.6 kg in the observation period or in two months; parameters are in line with the recommendations set by the National Institute of Health of between 250 and 1000 grams per week. Most patients trying to lose weight do not employ the recommended combination of reducing calorie intake and engaging in leisure-time physical activity of 150 minutes or more per week. The degree of caloric restriction, exercise and rate of weight loss influence the proportion of weight lost. Comparison of different diets gives clear evidence that the degree of caloric restriction affects %FFML. Previous studies demonstrated that the increased initial rate of weight loss achieved using VLCDs compared with LCDs may be the cause of the greater FFM loss on these diets, at least in the short term (9). VLCDs provide quite rapid weight loss and substantial loss of FFM, but stable weight may be more important in terms of the long-term benefits of living a healthier lifestyle.
Exercise training is associated with an increase in energy expenditure, thus promoting changes in body composition and bodyweight while keeping dietary intake constant. The advantages of strength training may have greater implications than initially proposed with respect to decreasing percentage body fat and sustaining FFM (18).
Group one, which had the smaller caloric restriction, obtained one of the best results in terms of fat mass loss and muscle maintenance. We may therefore conclude that excessive caloric restriction is not required to achieve the best results. A less restrained diet would be easier to maintain in the long term because it requires fewer sacrifices (19).
These results also show that as regards the effectiveness of the diet correct directions by the dietitian on nutritional choices and physical activity are more important than the degree of caloric restriction. Perhaps we simply need to tell our patients which food they need to avoid and what sort of physical activity they should do without stringent and often unrealistic calorie restrictions.
Our retrospective study found useful conclusions in relation to the various degrees of calorie restriction for proper weight loss. It could be argued that a smaller restriction of daily calorie intake results in the short term in a significant decrease in weight in terms of fat mass and stabilisation of lean body mass. On the other hand, it is clear that a higher caloric restriction did not lead to a more significant FM decrease. The study could open up new areas of inquiry in relation to healthy lifestyle and physical activity prescriptions for ideal weight loss.
Conclusions
Patients usually lose weight while on a programme but regain weight after they revert to their former lifestyle. We demonstrated that a lower energy restriction is enough to obtain similar %FML and preserve FFM than more unrealistic weight loss programmes not suitable for long-term lifestyle results.
Conflict of interest: The authors declares that there is no conflict of interest regarding the publication of this paper.
Ethical standard: All procedures followed were in accordance with the ethical standards of the responsible committee on human experimentation (institutional and national) and with the Helsinki Declaration of 1975, as revised in 2008. Informed consent was obtained from all patients for being included in the study.
References
1. Serdula MK, Mokdad AH, Williamson DF, Galuska DA, Mendlein JM, Heath GW. Prevalence of attempting weight loss and strategies for controlling weight. JAMA. 1999 Oct 13;282(14):1353-8. PubMed PMID: 10527182.
2. Bosy-Westphal A, Geisler C, Onur S, Korth O, Selberg O, Schrezenmeir J, Müller MJ. Value of body fat mass vs anthropometric obesity indices in the assessment of metabolic risk factors. Int J Obes (Lond). 2006 Mar;30(3):475-83. PubMed PMID: 16261188.
3. Rachel A. Millstein. Measuring Outcomes in Adult Weight Loss Studies That Include Diet and Physical Activity: A Systematic Review. Journal of Nutrition and Metabolism, vol. 2014, Article ID 421423, 13 pages, 2014. doi:10.1155/2014/421423
4. Bosy-Westphal A, Schautz B, Lagerpusch M, Pourhassan M, Braun W, Goele K,Heller M, Glüer CC, Müller MJ. Effect of weight loss and regain on adipose tissue distribution, composition of lean mass and resting energy expenditure in young overweight and obese adults. Int J Obes (Lond). 2013 Oct;37(10):1371-7. doi:10.1038/ijo.2013.1. Epub 2013 Feb 5. PubMed PMID: 23381557.
5. Mendez MA, Popkin BM, Jakszyn P, Berenguer A, Tormo MJ, Sanchéz MJ, Quirós JR, Pera G, Navarro C, Martinez C, Larrañaga N, Dorronsoro M, Chirlaque MD, Barricarte A, Ardanaz E, Amiano P, Agudo A, González CA. Adherence to a Mediterranean diet is associated with reduced 3-year incidence of obesity. J Nutr. 2006 Nov;136(11):2934-8. PubMed PMID: 17056825.
6. Sacks FM, Bray GA, Carey VJ, Smith SR, Ryan DH, Anton SD, McManus K, Champagne CM, Bishop LM, Laranjo N, Leboff MS, Rood JC, de Jonge L, Greenway FL, Loria CM, Obarzanek E, Williamson DA. Comparison of weight-loss diets with different compositions of fat, protein, and carbohydrates. N Engl J Med. 2009 Feb 26;360(9):859-73. doi: 10.1056/NEJMoa0804748
7. De Souza RJ, Bray GA, Carey VJ, Hall KD, LeBoff MS, Loria CM, Laranjo NM, Sacks FM, Smith SR. Effects of 4 weight-loss diets differing in fat, protein, and carbohydrate on fat mass, lean mass, visceral adipose tissue, and hepatic fat: results from the POUNDS LOST trial. Am J Clin Nutr. 2012 Mar;95(3):614-25. doi: 10.3945/ajcn.111.026328. Epub 2012 Jan 18.
8. Villareal DT, Chode S, Parimi N, Sinacore DR, Hilton T, Armamento-Villareal R, Napoli N, Qualls C, Shah K. Weight loss, exercise, or both and physical function in obese older adults. N Engl J Med. 2011 Mar 31;364(13):1218-29. doi: 10.1056/NEJMoa1008234. PubMed PMID: 21449785; PubMed Central PMCID: PMC3114602.
9. Chaston TB, Dixon JB, O’Brien PE. Changes in fat-free mass during significant weight loss: a systematic review. Int J Obes (Lond). 2007 May;31(5):743-50. Epub 2006 Oct 31. Review. PubMed PMID: 17075583
10. Psota T, Chen K. Measuring energy expenditure in clinical populations: rewards and challenges.European journal of clinical nutrition. 2013;67(5):436-442. doi:10.1038/ejcn.2013.38.
11. Jebb SA, Siervo M, Murgatroyd PR, Evans S, Frühbeck G, Prentice AM. Validity of the leg-to-leg bioimpedance to estimate changes in body fat during weight loss and regain in overweight women: a comparison with multi-compartment models. Int J Obes (Lond). 2007 May;31(5):756-62. Epub 2006 Oct 24. PubMed PMID: 17060926.
12. Lombardo, M., Bellia, A., Padua, E., Annino, G., Guglielmi, V., D’Adamo, M., … & Sbraccia, P. Morning meal more efficient for fat loss in a 3-month lifestyle intervention. Journal of the American College of Nutrition, 2014;33(3), 198-205. PMID: 24809437
13. Keys A, Menotti A, Karvonen MJ, Aravanis C, Blackburn H, Buzina R, Djordjevic BS, Dontas AS, Fidanza F, Keys MH, et al. The diet and 15-year death rate in the seven countries study. Am J Epidemiol. 1986 Dec;124(6):903-15. PubMed PMID: 3776973
14. Donnelly JE, Blair SN, Jakicic JM, Manore MM, Rankin JW, Smith BK; American College of Sports Medicine. American College of Sports Medicine Position Stand. Appropriate physical activity intervention strategies for weight loss and prevention of weight regain for adults. Med Sci Sports Exerc. 2009 Feb;41(2):459-71. doi: 10.1249/MSS.0b013e3181949333. Erratum in: Med Sci Sports Exerc. 2009 Jul;41(7):1532. PubMed PMID: 19127177.
15. Mancini JG, Filion KB, Atallah R, Eisenberg MJ. Systematic Review of the Mediterranean Diet for Long-Term Weight Loss. Am J Med. 2016 Apr;129(4):407-415.e4. doi: 10.1016/j.amjmed.2015.11.028. Epub 2015 Dec 22. PubMed PMID: 26721635.
16. Clark JE. Diet, exercise or diet with exercise: comparing the effectiveness of treatment options for weight-loss and changes in fitness for adults (18–65 years old) who are overfat, or obese; systematic review and meta-analysis. Journal of Diabetes and Metabolic Disorders. 2015;14:31. doi:10.1186/s40200-015-0154-1.
17. Heymsfield SB, Gonzalez MC, Shen W, Redman L, Thomas D. Weight loss composition is one-fourth fat-free mass: a critical review and critique of this widely cited rule. Obes Rev. 2014 Apr;15(4):310-21. doi: 10.1111/obr.12143. Epub 2014 Jan 22. Review. PubMed PMID: 24447775; PubMed Central PMCID: PMC3970209.
18. Gilliat-Wimberly M, Manore MM, Woolf K, Swan PD, Carroll SS. Effects of habitual physical activity on the resting metabolic rates and body compositions of women aged 35 to 50 years. J Am Diet Assoc. 2001 Oct;101(10):1181-8. PubMed PMID: 11678489.
19. Teixeira PJ, Silva MN, Mata J, Palmeira AL, Markland D. Motivation, self-determination, and long-term weight control. The International Journal of Behavioral Nutrition and Physical Activity. 2012;9:22. doi:10.1186/1479-5868-9-22.

