W.H. Oldewage-Theron, B.A.Z. Abu
Department of Nutritional Sciences, College of Human Sciences, Texas Tech University, USA
Corresponding Author: Wilna H. Oldewage-Theron, Department of Nutritional Sciences, College of Human Sciences, Texas Tech University, United States of America, Telephone: 8068340567, E-mail: wilhelmina.theron@ttu.edu
J Aging Res Clin Practice 2017;6:238-245
Published online November 30, 2017, http://dx.doi.org/10.14283/jarcp.2017.32
Abstract
Objectives: To determine household food insecurity and dietary diversity (DD) among seniors in Lubbock, Texas and examine the relationships between food security status and DD. Design: Cross-sectional study design. Setting: Lubbock, Texas. Participants: 200 seniors (≥ 50 years) randomly selected from seven senior centers and Meals on Wheels. Measurements: Socio-demographic and economic questionnaire, the validated Household Food Insecurity Access Scale (HFIAS) for food security and coping strategies, the validated DD scale for measuring the minimum DD for women (MDD-W), and weight and height measurements. P<0.05 considered significant was used for all statistical analyses. Results: The majority of the respondents (59.8%) were categorized as food secure. No significant relationships were observed between DD and HFIAS. The linear regression analysis carried out on the socio-demographic predictors of food security showed that age, household income and money spent on food per month were predictors of food security (R2= 0.233; p<0.000; SEE=4.462). The number of people in the household was the only predictor for DD score (R2= 0.028; p<0.000; SEE=1.929). Conclusions: This study showed a serious problem of household food insecurity among seniors in Lubbock, Texas affecting 40% of seniors. The results provide some of the first insights into seniors’ food security status and DD. No relationship could be established between food security status and DD in this study. Only household size was a predictor for DD in this study and further research is needed to determine quantity of dietary intakes and factors influencing the dietary patterns.
Keywords: food security, dietary diversity, seniors, socio-demographic, HFIAS.
Introduction
Seniors represented 14.5% of the total United States (US) population in 2014. It is predicted that this number will grow to 98 million by 2060, more than double the population in 2014 (1). With this growth in the senior population, the risk for developing chronic lifestyle diseases (CLDs) is also increasing among them (2) and this may result in loss of independence, disability and poor quality of life (3). CLDs such as coronary and cardiovascular disease, obesity, cancer and type 2 diabetes, as well as arthritis are among the most common and costly health problems in the US. Obesity is also a serious public health concern in the US as more than one-third of adults were obese during 2009-2010 (4). CLDs can be prevented through proper nutrition forming part of a healthy lifestyle (3).
Food insecurity means that people do not have “physical, social and economic access to food of sufficient quantity and quality in terms of variety, diversity, nutrient content and safety to meet their dietary needs and food preferences for an active and healthy life, coupled with a sanitary environment, adequate health, education and care” at all times (5). Seniors often consume inadequate quantities of food mainly due to food insecurity. The cause of food insecurity is multifactorial, among them are social support, budgetary constraints, and often also ethnicity and gender (6, 7). The threat of hunger, thus food insecurity, among seniors has increased by 47% from 2001 to 2014 in the US (8). This is consistent with another study that found that nearly 8.5% of seniors had limited or uncertain access to adequate food for sustaining a healthy lifestyle (9). Despite the availability of Social Security funds, Medicare and food assistance programs, seniors with limited resources are very vulnerable to food insecurity when having to cope with various health, social and nutrition challenges (10). Furthermore, malnutrition is also higher among the aforementioned groups of seniors as well as those with a disability (9). Poor dietary intakes and malnutrition among seniors are exacerbated by poor sensory function, digestive disorders, reduced physical activity, disabilities, and established poor food consumption habits (11). Malnutrition is often unrecognized and neglected (12, 13) in seniors and under nutrition should be one of the main causes of concern for seniors due to its association with morbidity and mortality (9).
Dietary diversity (DD) has been identified as a key predictable element of high quality diets in terms of nutrient adequacy globally. As a result, in most countries a diversified diet is prescribed as one of the dietary guidelines to improve health (14, 15). Resource-poor communities usually experience difficulty in achieving DD as they can consume a monotonous diet (14, 16). It is difficult to achieve food and nutrition security and DD when consuming monotonous diets as diets with few food groups are often deficient in multiple micronutrients and also have a relatively poor protein quality due to limiting amino acids (17). Diversified diets are thus necessary for the achievement of balanced nutrient intake for optimal nutrition. Optimal nutrition is essential for functional health status and mental well-being in seniors (14). In seniors, dietary diversity are influenced by many factors such as medical, socio-economic, functional status and other age-related challenges (15).
Studies on food insecurity and diet quality in terms of diversity among seniors in the US, specifically for Texas, are scarce (6). The purpose of this paper is to provide evidence of household food insecurity and poor dietary diversity among seniors in Lubbock, Texas and will examine the relationships between food security status and diet quality, measured as DD.
Methods
Study Design
A cross-sectional study design was used. The Institutional Review Board (IRB) at Texas Tech University approved the study (505619). Before the cross-sectional data collection, a feasibility assessment survey was conducted. The researchers visited Lubbock Meals on Wheels, five public senior centers serving congregated meals, a homestead and a live-in senior community to explain the objectives of the project and to acquire consent for the project from the center management.
Respondents and Sampling
A sample size calculation (18) was used at a 95% confidence level and confidence interval of 7.5. A statistically representative sample size of 170 seniors was required and, anticipating possible non-response or incomplete surveys, 200 seniors (≥ 50 years) were randomly selected from those who gave informed consent. A total of seven senior centers and Meals on Wheels were randomly selected and 25 respondents from each were selected.
Data Collection and Tools
Measurements were taken during June and July 2016. Demographic variables collected included ethnicity, educational status, gender, age, household income and household size (1, 8).
Food security and coping strategies were assessed using the validated Household Food Insecurity Access Scale (HFIAS) which has nine dichotomous (Yes/No) and nine follow-up questions to indicate severity [(1=Rarely (1-2 times); 2=Sometimes (3-10 times) and 3=Often (more than 10 times)]. The food security and access situation for the one month prior to the data collection date was collected. The procedures as described by Coates and co-authors were followed to calculate HFIAS and the HFIAS score (19). Other food security and access related questions included mode of transportation, seniors’ perception on changes that will improve the access to food and their participation in food assistance programs, and an open-ended question on what foods they will buy if they had more money.
Dietary diversity was assessed using the validated DD (20) scale for measuring the minimum dietary diversity for women (MDD-W) for the 24 hours prior to the interview. This tool constitutes ten nutritious food groups namely; 1) Grains, white roots and tubers, and plantains 2) Pulses (beans, peas and lentils) 3) Nuts and seeds 4) Dairy 5) Meat, poultry and fish 6) Eggs 7) Dark green leafy vegetables 8) Other vitamin A-rich fruits and vegetables 9) Other vegetables, and, 10) Other fruits. Each group was expanded using the available foods in Texas.
Weight was measured using a scale to the nearest 0.1kg and height measured to the nearest 0.1cm using a calibrated stadiometer. The weight and height was used to calculate their body mass index (BMI). Precautions were taken to ensure consistent measurements for all seniors (21). The seniors were also asked if any chronic condition or disability was prevalent at the time of the survey.
Statistical Analysis
A complete database for 184 seniors was used for data analyses using the IBM SPSS, version 23 with p<0.05 considered significant for all statistical analyses. Linearity regression was used to test all continuous variables for normality. Most variables were normally distributed. Demographic data were analyzed for frequencies and means and standard deviations (SDs).
The HFIAS score was calculated by adding the sum of all follow up questions (1a to 9a) testing the severity of food insecurity. Thus the score is anything between 0 and 27. Individual food insecurity levels were grouped according to four ordinal categories; 1=Food Secure, 2=Mildly Food Insecure Access, 3=Moderately Food Insecure Access, 4=Severely Food Insecure Access (19). Frequencies were calculated for prevalence rates as well as for the coping strategies for all the groups.
DD was measured by allocating a score of “1” for eating at least one food from a food group. The total score ranged from (0-10) and using intakes, individuals were grouped into low DD (1-4 food groups) and adequate DD (5-10 food groups) groups. The mean±SD was calculated for each of the food groups, indicating the individual food group diversity scores (FGDS).
BMI was calculated as weight (kg) divided by height squared (m2). Using the World Health Organization (WHO) guidelines, the BMI was categorized as underweight (<18.50kg/m2), normal (18.50 – 24.99 kg/m2), overweight (25.00 – 29.99kg/m2) and obese (≥30.00 kg/m2) (22-25).
Independent samples t-tests (nominal data) and linear by linear chi-square associations (categorical data) were done to determine significant differences between the food security groups. Pearson and Kendall Tau correlations were calculated for nominal and categorical data respectively. To assess the difference between seniors with low and adequate DD, chi-square was used in analysis for categorical data and the Bonferroni adjustments done. The t-test was used to find the mean difference between continuous variables such age, income, number of household members, body mass index and HFIAS score. Levene’s test for equality of variance was used. To understand the predictors of household food security status (food security and food insecurity), linear regression (age in years, household monthly income, household monthly expenditure on food) and a binary logistic regression (gender, ethnicity, education status) was carried out with those dependent variables that had a significant correlation with household food security status. Regression analysis showed no significance when all the confounding variables were adjusted with household food insecurity status.
Results
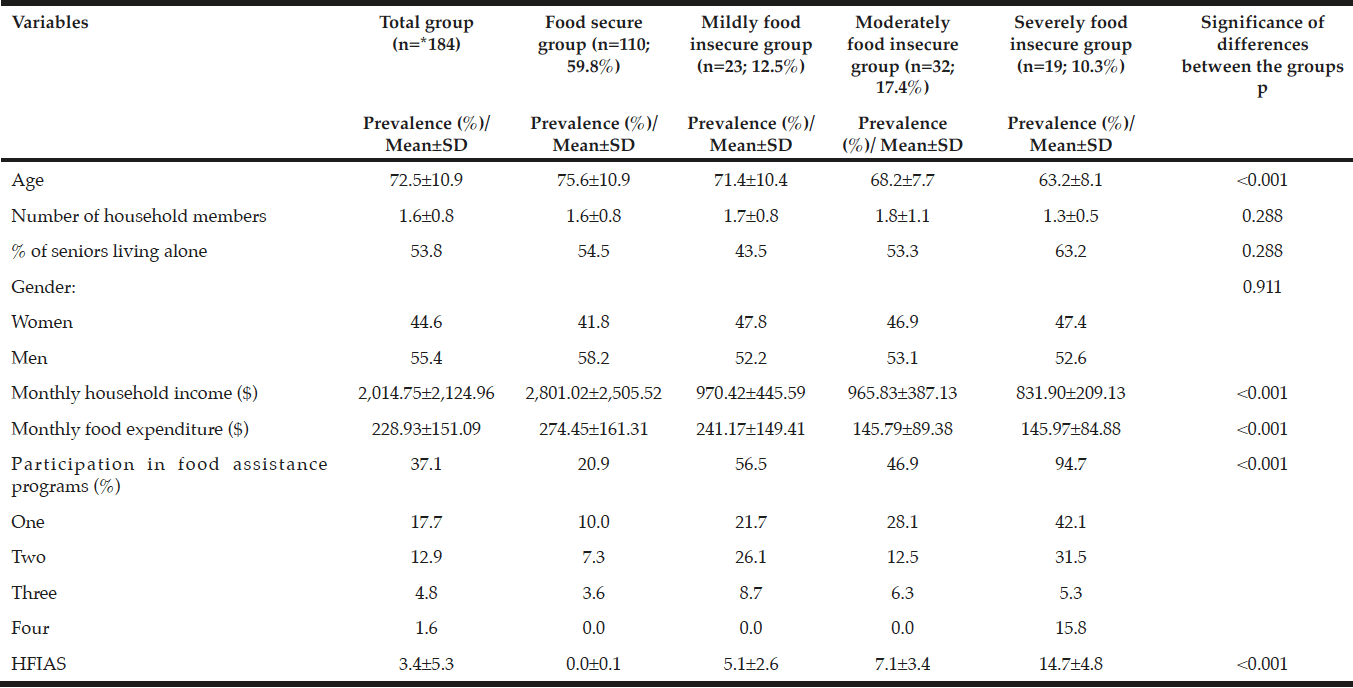
The mean±SD age of the respondents was 72.6±10.8 years. More men (n=103, 56.0%) than women (n=81, 44.0%), participated in the study. The ethnic distribution was mainly white (49.5%), Hispanic (24.2%) and African American (22.6%) respondents. The main source of income was from Social Security grants for the majority of the respondents (80.3%); however, 9.8% received income from another pension fund. The mean±SD monthly household net income of the respondents was $2,014.75±2,124.96. A statistically significant difference (p<0.001) in household income was observed between the food secure and different food insecure groups. The mean±SD monthly household income was $2,801±2,506 for food secure, but lower for food insecure groups at $970±446 for mildly, $966±387 for moderately and $832±209 for the severely food insecure group. The same trend was observed for the amount spent on food monthly (Table 1). The food insecure groups participated in more food assistance programs than the food secure group (p<0.001). The mean±SD monthly food expenditure was significantly different (p<0.001) between the groups with $274±161for food secure, $241±149 for mildly, $146±89 for moderately and $146±85 for severely food insecure seniors.
* 2 missing values for food security
Prevalence of food insecurity
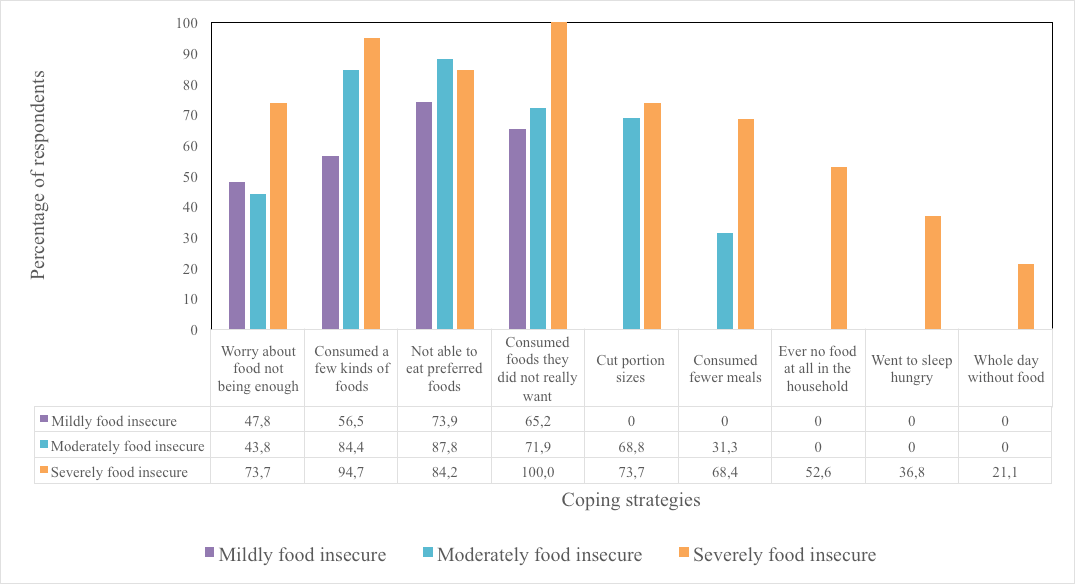
The majority of the respondents (59.8%) were categorized as food secure (HFIA1), with 12.5% categorized as mildly (HFIA2), 17.4% moderately (HFIA3) and 10.3% severely food insecure (HFIA4). The coping strategies employed by the food insecure groups showed a significant (p<0.001) difference between the groups. The results in Figure 1 show that respondents from all the food insecure groups indicated that they worried about food not being enough in the household. Several coping strategies were used progressively as food insecurity status deteriorated. None of the coping strategies in the HFIAS scale were employed by the food secure group.
Dietary diversity
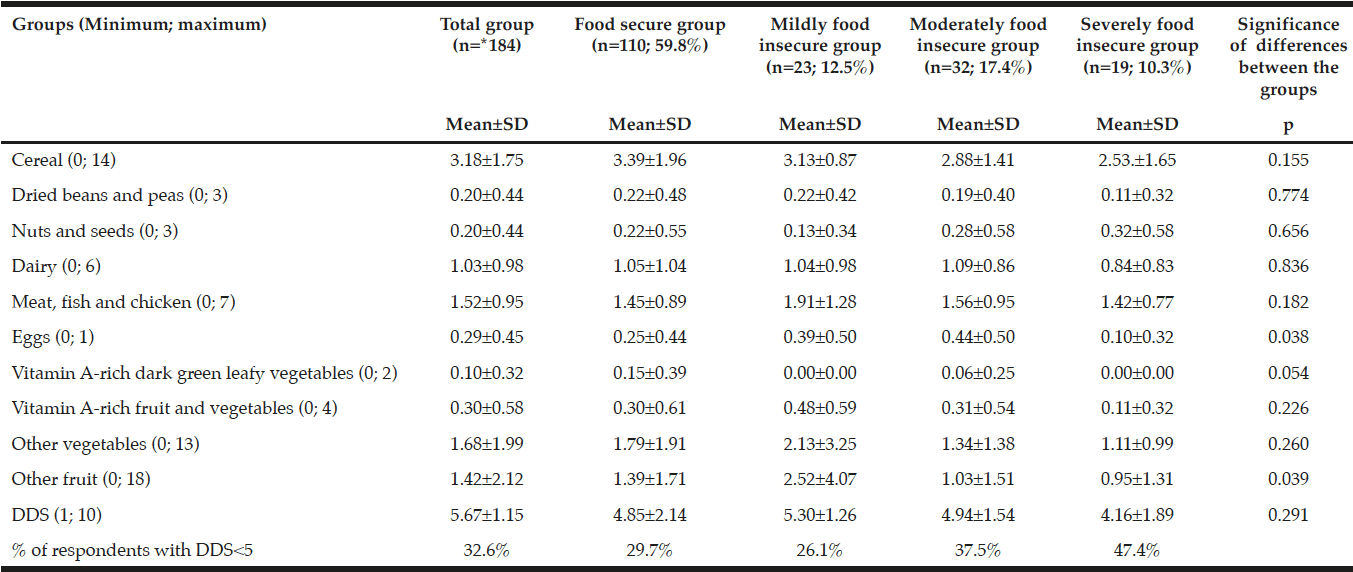
In total, 115 different foods were consumed by the respondents during the 24-hour period prior to data collection. The cereal group showed the most diversity, ranging from a mean±SD intake of 2.53±1.65 and 3.39±1.96 food items consumed in the severely food insecure and food secure groups respectively. A trend was observed that the FGDS became progressively lower as food security status deteriorated for all the food groups, except for the nuts and seeds food group, however, not significant. Significant differences between the groups were only observed for the eggs (p=0.038) and other fruit (p=0.039) groups. No significant difference (p=0.291) in DDS was observed between the groups, however, in the food secure group, 29.7% of the respondents did not include 5 or more groups, also indicating poor DD.
* 2 missing values for food security
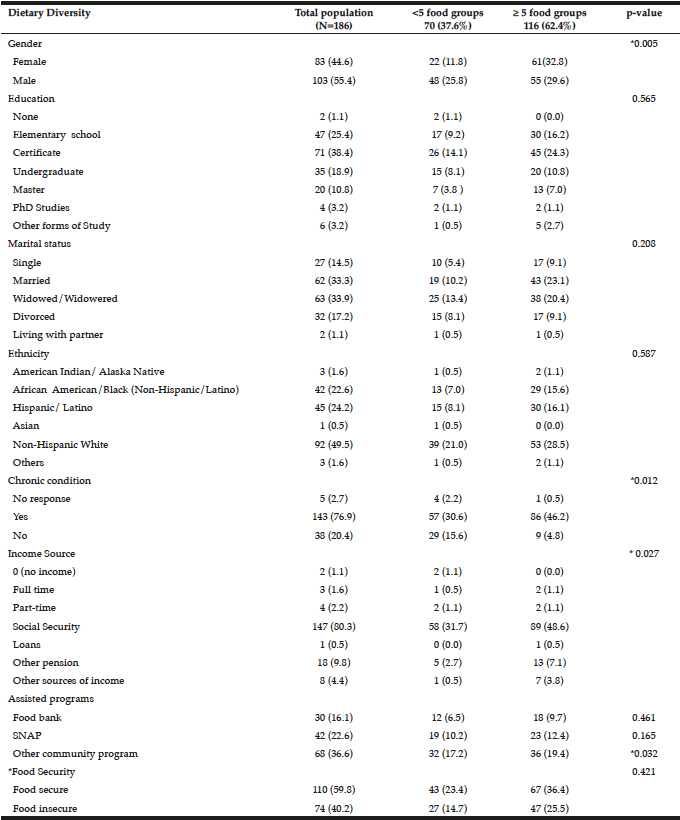
From Table 3 socio-demographic data of the senior citizens indicate that more males had low DD compared to women (p=0.005). Interestingly, the educational status was not significantly associated with DD. Low DD was observed in those respondents that were widowed/widowered and divorced. Married seniors were also more likely to have a higher DD. Non-Hispanic white seniors were more likely to have low DD (21.0%). Having a chronic condition was significantly associated (p=0.012) with DD, almost a similar proportion 30.6% for low DD compared to 46.2% for adequate DD. Seniors with low DD also seem to have a lower median age, monthly income, monthly budget for food and number of hours spent working. The seniors’ source of income was also associated with DD and the highest proportion being among seniors on social security (p=0.027). Participating in food assistance programs were not significantly associated with DD, but respondents participating in community food programs were significantly (p=0.032) higher in the adequate (19.4%) compared to poor (17.2%) DD group.
SD is standard deviation, * Statistically significant
Nutritional status
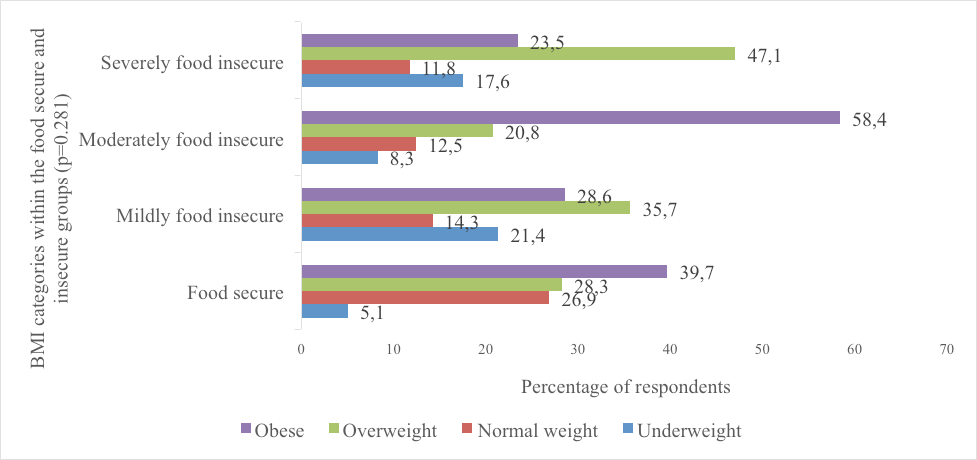
The results in Figure 2 show that no significant (p=0.281) differences in BMI were observed between the groups. The majority of the respondents were overweight or obese. However, a higher prevalence of underweight was observed in the food insecure groups.
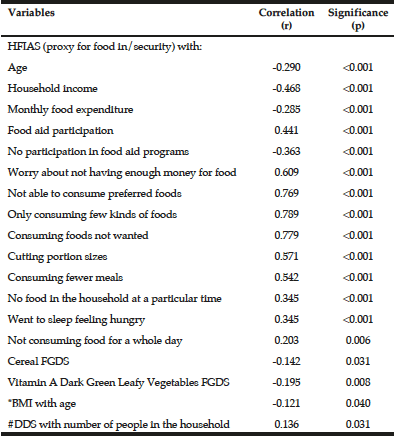
No significant relationships were observed between DD and HFIAS (proxy for food security status) or nutritional status (BMI). A significant positive relationship between DDS and the number of people in the household (r=0.136; p=0.031) existed. Furthermore, a significant positive relationship was also observed between HFIAS score and participation in food aid programs (r=0.441; p<0.001) and all the coping strategies (p<0.001) whereas an inverse relationship was observed between HFIAS score and age (r=-0.290, p<0.001), monthly household income (r=-0.468, p<0.001), monthly food expenditure (r=-0.285, p<0.001) and no food assistance participation (r=-0.357, p<0.001) (Table 4).
The linear regression analysis carried out on the socio-demographic predictors of food security (HFIAS) showed that age and household income and money spent on food per month were predictors of food security (R2= 0.233; p<0.000; SEE=4.462). The number of people in the household was the only predictor for DDS (R2= 0.028; p<0.000; SEE=1.929).
*Age was adjusted for and #household size was adjusted for in the correlation
Discussion
To our knowledge, this is the first study in which the relationship between food insecurity and DD has been assessed in a sample of seniors in Lubbock, Texas. Consuming a variety of foods (DD), is considered a key indicator of nutrient adequacy (14), which is apparent from the 2015-2020 Dietary Guidelines for Americans focusing on variety in all food groups (26).
In 2014, 1.1 million (3.2%) of households with seniors aged 65 and older were food insecure in America (27). This study found a much higher prevalence of food insecurity with 12.5% of the seniors participating in this study being categorized as mildly, 17.4% as moderately and 10.3% as severely food insecure respectively. Food insecurity is often associated with poor dietary intakes due to a lack of resources to access a healthy diet (10, 28). The mean monthly household income of the food secure seniors in this study of $2,801.02 was significantly higher than the household income for the food insecure groups. Similarly, the amount spent on food per month of $274.45 in the food secure group was significantly higher than for the food insecure groups. The results further indicated that the monthly household income and money spent on food was getting significantly and progressively lower as the food insecurity status deteriorated as confirmed by the significant inverse correlation between monthly household income and money spent on food with food security status. The US Department of Agriculture (USDA) focuses on empowering households to make healthier food choices by providing science-based advice, while expanding the availability of healthy food through farmers markets and food assistance programs (29) through federal food assistance programs designed to address food insecurity among specific populations, including seniors (30). In this study, a fifth of the food secure group participated in food assistance programs compared to 56.5% and 46.9% of the mildly and moderately food insecure groups. The food insecure groups had respondents participating in one, two or three food assistance programs respectively. Almost all of the severely food insecure group (94.7%) had respondents participating in one (42.5%), two (31.5%), three (5.3%) and even four (15.8%) different food assistance and community programs. This was confirmed by the significant positive relationship between food insecurity and food assistance and community program participation observed in this study.
USDA also provides information on shopping strategies and meal planning to help families consume affordable and nutritious meals through its Thrifty Food Plan (29). The thrifty food plan consists of a nutritious, minimal-cost diet (31). The median daily amount spent on food per person ranged from 10.39-$2.45 for the food secure group, compared to $9.43-$1.41, $5.76-$0.72 and $6.4-$1.42 for the mildly, moderately and severely food insecure groups accordingly. This translates into only the food secure and mildly food insure seniors being able to afford a thrifty food plan costed as $6.04 per person per day in February 2017 (32). Food insecurity is often associated with poor diet quality in seniors (28). Furthermore, a meta-analysis has shown that healthier food-based diet patterns cost about US$1.50 per day more than less healthy diet patterns in 2013. The same study asserts that the relatively higher cost of healthy foods may influence the quality of diet in resource-poor populations (33). The food insecure respondents in this study are thus at risk of not consuming a healthy diet. Our results were comparable to a study in Australian seniors where no significant relationship between food security status and diet quality was observed (2). However, the mildly food insecure group in this study was the only group that had a DDS of 5.30, indicating marginal dietary diversity. The food secure as well as the moderately and severely food insecure groups indicated a low DDS and thus an implicated suboptimal nutrient adequacy. Whole grains, seafood, lean meat, low-fat milk and fresh vegetables and fruit are bought more frequently by the higher income groups compared to more cereals, pasta, potatoes, legumes and fatty meats by the lower income groups (34).
In this study, food procurement patterns were not investigated, however, the FGDS for the cereal, dried beans and peas, vitamin A-rich dark green leafy vegetables, other vegetables and other fruit groups were lower than the food secure group in the moderately and severely food insecure groups, however, not significant. No significant relationship between DDS and any of the variables, including food insecurity, could be established, except for a significant positive relationship with the number of people in the household. In this study, the majority of the seniors had suboptimal dietary diversity, including the food secure group. Research has shown that food insecure seniors had lower nutrient intakes and that food insecurity could lead to both over- and under nutrition (2). In this study, 30.4% and 40.0% of the seniors were overweight and obese respectively. Only 8.9% of the seniors were underweight. No significant differences were observed in DDS and food security status between seniors’ BMI levels. It is thus not clear if food insecurity was a cause or outcome of poor DD and nutritional status. It was estimated that suboptimal diet quality accounted for 4% of all disability-adjusted life years in 2010 in the USA (33) and diet quality should not be disregarded, especially in seniors who already have compromised health. Research has further shown that resource-poor seniors have poorer quality diets and are more at risk of nutrition-related CDLs than those in the higher income groups (35, 36). In this study, 20.4% of the seniors reported prevalence of one or more CDL. Research has also shown inverse relationships between DD with CDLs such as hypertension, obesity, metabolic syndrome and cardiovascular diseases (15). Similarly, we found a significant relationship between having a chronic condition and DD in our study sample. It is well known that good nutrition is important for both prevention and management of chronic diseases (37).
Various coping strategies were employed by the food insecure groups that could exacerbate the impact of food insecurity and diet quality in the short and long term (38). Worrying about not having enough food in the household was experienced by 47.8% of the mildly food insecure respondents compared to 43.8% and 73.7% of the moderately and severely food insecure respondents respectively. This finding was confirmed by the positive correlation about food insecurity and worrying about enough food in the household. Severe coping strategies were employed by progressively more respondents as food insecurity levels deteriorated. The majority of the respondents in all three food insecure groups employed consumption of only a few kinds of foods, not eating preferred foods and consuming foods that the respondents did not really want. All the coping strategies were significantly associated with food insecurity levels. Food insecurity can affect nutrient intakes in part as a result of decreased nutrient intakes (9) which was confirmed in this study with the majority of the moderately (68.8%) and severely (73.3%) food insecure groups cutting portion sizes and 31.3% and 68.4% respectively consuming fewer meals. The majority of the severely food insecure group further experienced times when there was no food in the house during the previous month with a third and a fifth who went to sleep hungry and had to go a whole day without food during the previous month respectively.
A limitation of this study is the recruitment from senior centers providing congregate and home delivery meals. The results can thus not be generalized to seniors in general. Furthermore, this was a cross-sectional study and no causal pathways between food insecurity and dietary diversity could be drawn. Longitudinal studies are thus recommended to further explore relationships.
Conclusion
This study points to a serious problem of household food insecurity among seniors in Lubbock, Texas affecting four out of every 10 seniors. The results of this study provide some of the first insights into their food security status and DD. Suboptimal DD was found among both food secure and food insecure seniors, however, no relationship could be established between food security status and DD in this study. Only household size was a predictor for DD in this study and further research is needed to determine quantity of dietary intakes and factors influencing the dietary patterns. Furthermore, appropriate interventions, such as nutrition education and possible food production strategies, should be implemented among seniors either at a community or household level to address suboptimal DD and the high prevalence of food insecurity. Food procurement, preparation and meal planning skills could be included as part of the nutrition education interventions. These interventions may provide special focus on male seniors who live alone. The importance of DD in alleviating nutritional problems and related diseases should also be included (39) in such education programs.
Acknowledgements: We hereby acknowledge the Texas Tech University for funding this project, as well as the elderly care centres’ and Meals on Wheels’ management and respondants in this study. We also wish to acknowledge Ziaul H Rana, Gifty Sienso, Bong Nguyen, Sanjoy Saha and Chanasa Anokwuru for their valuable assistance in data collection.
Conflict of interest: None.
Ethical standard: The institutional review Board (IRB) at Texas Tech University approved the study (505619). Data were only collected from those repondants who signed informed consent. All the Belmont report ethical principles and guidelines for the protection of human subjects of research (1979) were followed during data collection.
References
1. United States Department of Human and Health Services (HHS), Administration for Community Living (ACL). Profile of Older Americans:2015. https://aoa.acl.gov/Aging_Statistics/Profile/2015/3.aspx. Accessed 22 March 2017.
2. Russell JC, Flood VM, Yeatman H, Wang JJ, & Mitchell P. Food insecurity and poor diet quality are associated with reduced quality of life in older adults. Nutr Diet 2016;73(1):50-8.
3. Bowman S. Low economic status is associated with suboptimal intakes of nutritious foods by adults in the National Health and Nutrition Examination Survey 1999-2002. Nutr Res 2007;27(9):515-523.
4. Centers for Disease Control and Prevention (CDC). Chronic disease overview. 2016. https://www.cdc.gov/chronicdisease/overview/. Accessed 19 March 2017.
5. Food and Agriculture Organization of the United Nations (FAO). Causes of Malnutrition. 2016. http://www.fao.org/docrep/w0073e/w0073e03.htm. Accessed 28 September 2016.
6. Oemichen M, & Smith C. Investigation of the Food Choice, Promoters and Barriers to Food Access Issues, and Food Insecurity Among Low-Income, Free-Living Minnesotan Seniors. J Nutr Educ Behav2016;48(6):397-404.
7. Shanks CB, Haack S, Tarabochia D, Bates K, Christenson L. Factors influencing food choices among older adults in the rural western USA. J Community Health 2016;p 1-11. doi 10.1007/s10900-016-0283-6.
8. Ziliak JP, & Gundersen C. The State of Senior Hunger in America 2014: An Annual Report, Supplement. National Foundation to End Senior Hunger (NFESH). 2016. http://www.nfesh.org/wp-content/uploads/2016/05/State-of-Senior-Hunger-in-America-2014.pdf. Accessed 28 September 2016.
9. Wright L, Vance L, Sudduth C, Epps JB. The impact of home-delivered meal program on nutritional risk, dietary intake, food security, loneliness and social well-being. J Nutr Gerontol Geriatr 2015;34:218-227.
10. Bird CL, & McClellan JW. Educating limited resources older adults for better choices to lower risk of food insecurity. Int J Consum Stud 2016;41:225-233.
11. Rousset S, Droit-Volet S, & Boirie Y. Change in protein intake in elderly French people living at home after a nutritional information program targeting protein consumption. J Am Diet Assoc 2006;106(2):253-261.
12. Setiati S, Harimurti K, Dewiasty E, et al. Profile of food and nutrient intake among Indonesian elderly population and factors associated with energy intake: a multi-centre study. Acta Med Indones 2013;45(4):265-274.
13. Agarwalla R, Saikia AM, & Baruah R. Assessment of the nutritional status of the elderly and its correlates. J Family Community Med 2015;22(1):39-43.
14. Rathnayake KM, Madushani PAE, & Silva KDRR. Use of dietary diversity score as a proxy indicator of nutrient adequacy or rural elderly people in Sri Lanka. BMC Res Notes 2012;5:469.
15. Tavakoli S, Dorosty-Motlagh AR, Hoshiar-Rad A, et al. Is dietary diversity a proxy measurement of nutrient adequacy in Iranian elderly women? Appetite 2016;105:468-476.
16. Ruel MT. Operationalizing dietary diversity: a review of measurement issues and research priorities. J Nutr 2003;133:S3911:S3926.
17. Mahan LK, & Escott-Stump S. Krause’s food, nutrition and diet therapy. 2000. W.B. Saunders Company, Philadelphia.
18. The Survey System. Sample Size Calculator. https://www.surveysystem.com/sscalc.htm. Accessed 03 March 04, 2016.
19. Coates J, Swindale A,& Bilinsky P. Household Food Insecurity Access Scale (HFIAS) for Measurement of Household Food Access: Indicator Guide (v. 3). 2007. FHI 360/FANTA, Washington, D.C.
20. Food and Agriculture Organization of the United Nations (FAO), Family Health International (FHI 360). Minimum Dietary Diversity for Women: A Guide for Measurement. 2016. FAO, Rome.
21. Gibson RS. Principles of nutritional assessment. 2nd ed. 2005. Oxford University Press, New York.
22. World Health Organization (WHO). Physical status: the use and interpretation of anthropometry. Report of a WHO Expert Committee. WHO Technical Report Series 854. 1995. WHO, Geneva.
23. World Health Organization (WHO). Obesity: preventing and managing the global epidemic. Report of a WHO Consultation. WHO Technical Report Series 894. 2000. WHO, Geneva.
24. World Health Organization (WHO) expert consultation. Appropriate body-mass index for Asian populations and its implications for policy and intervention strategies. The Lancet 2004;157-163.
25. World Health Organization (WHO). BMI classification. 2016. http://apps.who.int/bmi/index.jsp?introPage=intro_3.html. Accessed 16 February 2017.
26. United States Department of Health and Human Services (HHS), United States Department of Agriculture (USDA). The 2015–2020 Dietary Guidelines for Americans. 8th Edition. 2015. http://health.gov/dietaryguidelines/2015/guidelines/. Accessed 19 March 2017.
27. National Commission on Hunger. Freedom from hunger: An achievable goal for the United States of American. Recommendations of the National Commission on Hunger to Congress and the secretary of the Department of Agriculture. 2015.
28. Myles T, Porter Starr KN, Johnson KB, Sun Lee J, Fischer JG, & Ann Johnson M. Food insecurity and eating behavior relationships among congregate meal participants in Georgia. J Nutr Gerontol Geriatr 2016;35(1):32-42.
29. United States Department of Agriculture (USDA). Thrifty food plan. Release nr. 0063.13. 2015.https://www.fns.usda.gov/tags/thrifty-food-plan. Accessed 04 March 2017.
30. Gergerich E, Shobe M, & Christy K. Sustaining Our Nation’s Seniors through Federal Food and Nutrition Programs. J Nutr Gerontol Geriatr 2015;34(3):273-291.
31. Carlson A, Lino M, Juan WY, Hanson K, & Basiotis PP. Thrifty Food Plan, 2006. (CNPP-19). United States Department of Agriculture, Center for Nutrition Policy and Promotion. 2007.
32. United States Department of Agriculture (USDA). Official USDA food plans: cost of food at home at four levels, US average, February 2017. 2017. https://www.cnpp.usda.gov/sites/default/files/CostofFoodFeb2017.pdf. Accessed 04 March 2017.
33. Rao M, Afshin A, Singh G, Mozaffarian D. Do healthier foods and diet patters cost more than less healthy options? A systematic review and meta-analysis. BMJ Open 2013;3:e004277.
34. Drewnowski A, & Eichelsdoerfer P. Can low-income Americans afford a healthy diet?. Nutr Today 2010;44(6):246.
35. Keller HH, Dwyer JJ, Senson C, Edwards V, & Edward G. A social ecological perspective of the influential factors to food access described by low-income seniors. J Hunger Environ Nutr 2006;1(3):27-44.
36. Keller HH, Dwyer JJ, Edwards V, Senson C, & Edward HG. Food security in older adults: community service provider perceptions of their roles. Can J Aging 2007;26(4):317-28. doi: 10.3138/cja.26.4.317.
37. Egger G, & Dixon J. Beyond obesity and lifestyle: a review of 21st century chronic disease determinants. BioMed Res Int 2014.
38. Ngidi MS, & Hendriks SL. Coping with Food Insecurity in Rural South Africa: The Case of Jozini, KwaZulu-Natal. Mediterr J Soc Sci 2014;5(25):278.
39. Bernstein MA, Tucker KL, Ryan ND, et al. Higher dietary variety is associated with better nutritional status in frail elderly people. J Am Diet Assoc 2012;102(8):1096:1104.

