J. Ares Blanco1,*, L. Moreno Díaz1, E. Fernández-Fernández1, A.J. López-Alba1
1. Endocrinology and Nutrition section, Hospital of Jove, Gijón; * Principality of Asturias Health Investigation Institute (ISPA)
Corresponding Author: Jessica Ares Blanco, C/ Bernardino Guardado 30, 33403 Avilés Asturias, Spain, Tel 652157275, jessiaresb@gmail.com.
J Aging Res Clin Practice 2019;8:15-19
Published online January 24, 2019, http://dx.doi.org/10.14283/jarcp.2019.3
Abstract
Background: There is an association between malnutrition and mortality. However, it is unclear if this association is truly independent of confounding factors. Objectives: The objective of this study is to evaluate nutritional status, defined according to the three categories defined in the Nutritional Screening Tool “Mini Nutritional Assessment”, and to investigate its prognostic involvement. Design, Setting and Participants: Single cohort retrospective observational study in hospitalized patients between December 2013 and January 2014, who were placed under observation until September 2015 (21 months) (n=144). Nutritional status was determined by MNA short form at the beginning of the study, as well as clinical and epidemiological data. Results: Based on categories defined by MNA SF, 59 (40.97%) were well nourished, 55 (38.19%) were at risk of malnutrition, and 30 (20.83%) patients showed malnutrition. 45 patients died during follow up (31.25%). Of them, 40% (18) were malnourished, 38% (17), at risk of malnutrition, and 22% (9), well nourished. After adjusting for confounding factors, hazard ratio (95% CI) for all-cause mortality was significantly greater in the malnourished group (3.44 (1,27-9,31: p 0,015)), comparing to the reference group (well-nourished patients). Conclusions: Nutritional status defined according to the 3 categories defined in MNA short form predicts the probability of mid-term death in hospitalized patients, after adjusting for confounding factors as age and comorbidities. These data show the importance of knowing nutritional status during hospitalization for avoiding potential complications and helping the patient to overcome them
Keywords: Malnutrition, nutrition screening tool, survival, comorbidities, elderly.
Introduction
It is widely described that there is a direct relationship between malnutrition and life expectance in elderly people (1). In fact, in Europe one out of three elderly patients who is admitted to the hospital shows malnutrition (2-4). This leads to longer hospital stays, higher number of hospital admissions and functional cognitive impairment (5, 6).
European Society for Clinical Nutrition and Metabolism (ESPEN) has defined malnutrition as a complex interaction between consequences of and underlying disease and its metabolic disturbance, and reduction of availability of nutrients (reduction of food intake and/or its absorption and/or increased losses) or a combination of them (7).
A review article published in 2012 about nutritional screening in hospitalized patients concluded that malnutrition was associated with increased mortality (8), although it is still unclear if this association is independent of confounding factors such as age and comorbidities.
On the recommendation of ESPEN (9), the most used nutritional screening tool in elderly people is MNA (2, 8). To facilitate data collection, we used MNA short form, which was based on the former tool, and validated in 2009 (10). According to the score, population is divided in 3 groups: well nourished ((≥12), at risk of malnutrition (8-11), and malnourished ((≤7)
The objective of the study is to confirm the importance of nutritional status in hospitalized patients as an independent prognostic factor, having previously adjusted for confounders (Charlson comorbidity index).
Methods
Study design and participants
Cohort of hospitalized patients in Jove Hospital between December 2013 and January 2014, who were placed under observation until September 2015 (21 months) (n=144). Nutritional status (based on MNA short form) and epidemiological and clinical data were determined.
Jove Hospital is located in Gijón, Asturias, and is provided with 261 beds, mostly distributed in the departments of Internal Medicine, General Surgery, Gynecology and Orthopedics.
The study was approved by the ethics committee of the hospital. Informed consent was obtained from the patient prior to testing.
Data collection
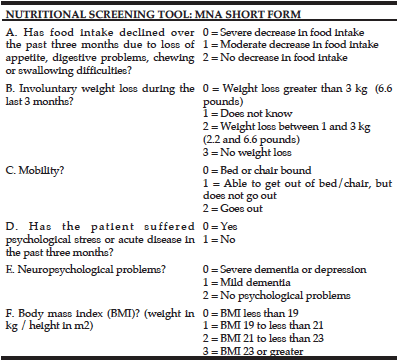
The initial phase of the project (December 2013-January 2014) collected baseline nutritional status during hospitalization determined by MNA short form (table 1). This tool consist of 6 items and classifies patients in 3 categories depending on nutritional status: 0-7 malnutrition, 8-11 at risk of malnutrition, and 12-14 well-nourished. In order to analyze the relationship between nutritional status and mortality, digital medical history was consulted (Selene®), according to our hospital protocol. During hospital stay, we collected data about comorbidities associated to the cause of hospitalization according to CIE-10 classification, as well as anthropometrical characteristics like weight, height or body mass index (BMI). The second phase of the study took place in September 2016, when cohort’s vital state was determined (through direct visualization in Selene®). We also searched for the number of hospital readmissions and emergency visits.
Screning Score: maximum 14 points 12-14 points: Normal nutritional status 8-11 points: At risk of malnutrition; 0-7 points: Malnourished
Statistical analysis
The main objective of this study was to examine the association between nutritional status according to MNA (malnourished, at risk of malnutrition and well-nourished) and survival during follow up. Time to death was calculated from the date MNA was done and the time of death.
Regarding descriptive statistics, data from categorical variables have been shown as frequencies and percentages (%), while discrete and quantitative variables have been shown as arithmetical medias and standard deviations.
Differences between the three groups were analyzed in Pearson test for categorical variables, Kruskal-Wallis for quantitative discrete variables and ANOVA for continuous quantitative variables.
The hazard ratio for median overall survival was calculated using the Cox regression model. Nutritional status was included as a categorical variable with 3 levels: well-nourished, at risk of malnutrition and malnourished. As confounding factors, age and Charlson comorbidity index (ChCI) were included. ChCI comprises 17 comorbidity categories obtained through anamnesis and/or the patient’s medical history. Each category was assigned a score based on 1-year mortality risk. Patient’s score was the result of the sum of comorbidities contemplated in ChCI.
Cox regression model was conducted in two steps. First step was comprised of nutritional status and possible confounders (age, ChCI, sex, BMI). Age and BMI were considered quantitative continuous variables; ChCI and sex, quantitative discrete. Thus, statistically significant variables (age and ChCI) were included in second step, using a multivariable logistic statistical model. Data were analyzed by IBM SPSS Statistics v 21.0®.
Results
Patient’s characteristics
144 patients were first evaluated. Average age was 67.8±2.9 years, with female predominance (54.1%).
Patients hospitalized in Short Stay Unit were excluded.
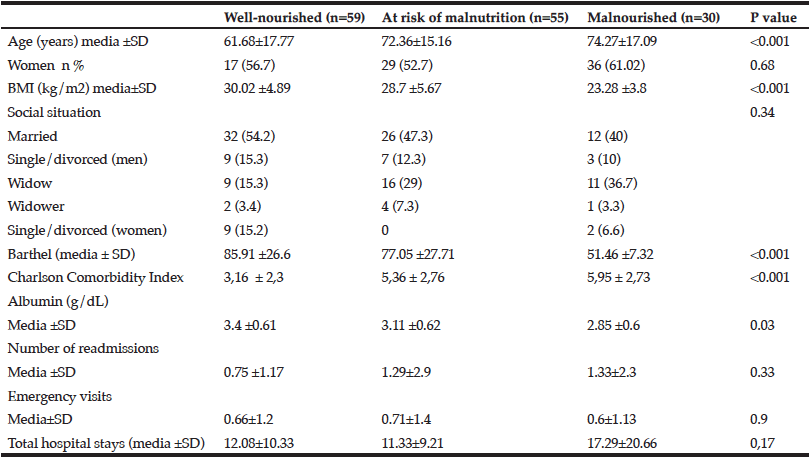
Table 1 shows baseline characteristics related to previous nutritional status. According to basal MNA, 59 (40.97%) were well nourished, 55 (38.19%) were at risk of malnutrition and 30 (20.83%) were malnourished. Malnourished patients were statistically older, with lower body mass and Barthel Indexes, and higher comorbidity index according to Charlson Classification.
Re-evaluation of our population showed greater number of readmissions in the group of patients with MNASF lower than 7, not statistically significant. Malnourished patients showed longer hospital stays (including subsequent admissions). Due to small sample size, this differences did not reach statistical significance (Table 2).
Survival analysis
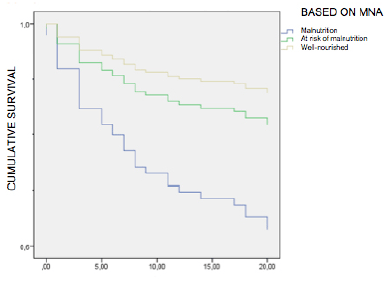
Follow-up period was 21 months. Over that time, 45 patients died (31.25%). Survival rate was different depending on nutritional status. For well-nourished people, it was 78%; malnourished, 60%, and at risk of malnutrition, 62% (p<0.001).
The hazard ratio (HR) (95% CI) for all-cause mortality was calculated using the univariate Cox regression model. For people at risk of malnutrition, it was 2.47 (0.91-6.76) (p 0.077); malnourished, 6.44 (2.34-17.72), compared to well-nourished patients (reference group).
After adjusting for confounders (age and ChCI) in a multivariate Cox regression model, HR (95% CI) for all-cause mortality was significantly higher in malnourished group: 3.44 (1.27-9.31: p 0.015), compared to reference group. These data are shown on Figure 1.
Discussion
From a physical point of view, malnutrition can result in loss of muscle and fat mass, reduction of respiratory musculature and cardiac function, and organ atrophy (11-13). 15% of unintended weight loss can result in reduction of muscle and respiratory strength, while a 23% loss is associated with a 70% decrease of physical abilities, 30% decrease of muscle mass and 30% increase in depression incidence (14).
From a psychological point of view, malnutrition is associated with asthenia and apathy, which leads to a delay in the disease recovery and further exacerbates anorexia and increases time for convalescence (13).
It is widely described that malnutrition is associated with an increase of hospital stay (15, 16). As stated in an US study about hospitalized patients for a minimum of 7 days with the aim to studying the negative impact of hospital stay in nutritional status. Results showed that patients who were malnourished at the time of admission and those who experienced deterioration in their nutritional status had longer hospital stays (an average of 4 extra days) than patients who were well nourished at the time of admission and discharge (17). Similarly, an Australian study found statistically significant differences between hospital stays of malnourished and well-nourished patients (5 days extra) (18).
PREDyCES® (19) study was developed in 2011 and included 1,576 patients attended at 31 health centers in the Spanish National Health System. According to this study, 23.7% of patients showed malnutrition at the time of hospital admission (using NRS-2002 screening tool). This percentage is similar to that found in our study, which also shows longer hospital stay in malnourished patients.
Therefore, we can interpret that, as in this metacentric study, expenditure per patient is increased according to nutritional status.
Despite evidence indicates that nutritionally-compromised patients suffer from more complications during hospital stay, it is difficult to isolate the influence of confounders and demonstrate that malnutrition on its own is related to increase of mortality. The fact that numerous international studies, in a wide variety of groups of patients and areas, describe similar findings, reinforces the idea that malnutrition consists in a decrease in survival. Thus, health authorities must concern population nutritional status.
According to our data, we can finally state that nutritional status acts as an independent risk factor for mortality (having previously adjusted by comorbidities and age).
Main weakness of this study is sample size, as hospital characteristics did not allow larger sample size. In fact, we were successful in knowing data of 80% inpatients in that moment (261 beds).
Malnutrition prevalence resulted in 20% of inpatients analyzed. There are multiple causes of malnutrition at hospital, those regarding hospitalization, disease itself, lack of dietitians or a Hospital Nutrition Unit, as occurs in our case (20).
There are several studies published about the relationship between malnutrition and mortality, most them being made without Logistical regression (5, 21-23), and only reporting hospital mortality, but two studies, the one published by Söderström et al (23) in 2014, which directly relates malnutrition in 1,767 patients aged 65 or over, and increase of 50-month mortality (HR 3.71 (2.28-6.04)); and other retrospective Australian study of 476 patients which found a HR for malnourished group of 3.4 (1.07-10.87), having previously adjusted for comorbidities at the time of admission (24). Moreover, a small Scandinavian study with prospective data analyzed 3 categories in MNA to predict malnutrition in 101 hospital inpatients aged 65 or more. After adjusting for age, sex and Charlson Comorbidity Index, they did not find any association between malnutrition and mortality after one year follow-up (25).
Conclusion
Our results show that performing nutritional screening at the time of hospital admission is a useful tool to determine the probability of having complications and poor outcome in a short period of time.
According to our data, MNA short form can be considered as a valid test to differentiate which patients are well-nourished from malnourished. There is no big difference between being at risk of malnutrition and malnourished regarding mortality.
We believe that we must encourage health authorities to worry more about this fact, by improving the access to nutritional screening tools in every hospital in order to provide the best patient care and decrease further costs.
Acknowledgements: I express my gratitude to Dr. López Alba for giving me the opportunity to do this study, and to Nutricia (particularly, Gonzalo Álvarez), for the resources they provided.
Funding: This study has been funded by Nutricia®.
Conflict of interest: This study has been funded by Nutricia®, but it has not been observed any attempt to access to confidential information by them.
This manuscript has been presented as a poster in SENPE (Sociedad Española de Nutrición Enteral y Parenteral) 2016 congress.
Ethical standard: All procedures followed were in accordance with the ethical standards of Jove Hospital and with the Helsinki Declaration of 1975, as revised in 2000. Informed consent was obtained from all patients for being included in the study.
References
1. Norman K, Pichard C, Lochs H, Pirlich M. Prognostic impact of disease-related malnutrition. Clin Nutr 2008;27(1):5-15.
2. Guigoz Y. The Mini Nutritional Assessment (MNA) review of the literature. What does it tell us? J Nutr Health Aging 2006;10(6):466-85.
3. Kaiser MJ, Bauer JM, Ramsch C, Uter W, Guigoz Y, Cederholm T, et al. Frequency of malnutrition in older adults: a multinational perspective using the mini nutritional assessment. J Am Geriatr Soc 2010;58(9):1734-8.
4. Meijers JM, Schols JM, van Bokhorst-de van der Schueren MA, Dassen T, Janssen MA, Halfens RJ. Malnutrition prevalence in The Netherlands: results of the annual Dutch national prevalence measurement of care problems. Br J Nutr 2009;101(3):417-23.
5. Amaral TF, Matos LC, Teixeira MA, Tavares MM, Alvares L, Antunes A. Undernutrition and associated factors among hospitalized patients. Clin Nutr 2010;29(5):580-5.
6. Saka B, Kaya O, Ozturk GB, Erten N, Karan MA. Malnutrition in the elderly and its relationship with other geriatric syndromes. Clin Nutr 2010;29(6):745-8.
7. Muscaritoli, M.; Anker, S.D.; Argiles, J.; Aversa, Z.; Bauer, J.M.; Biolo, G.; Bioirie, Y.; Bosaeus, I.; Cederholm, T.; Costelli, P.; Fearon, K.C.; Laviano, A.; Maggio, M.; Rossi Fanelli, F.; Schneider, S.M.; Schols, A.; Sieber, C.C. Consensus definition of sarcopenia, cachexia and pre-cachexia: Joint document elaborated by Special Interest Groups (SIG) ―cachexia-anorexia in chronic wasting diseases‖ and ―nutrition in geriatrics‖. Clin. Nutr. 2010, 29, 154-159.
8. Dent E, Visvanathan R, Piantadosi C, Chapman I. Nutritional screening tools as predictors of mortality, functional decline, and move to higher level care in older people: a systematic review. J Nutr Gerontol Geriatr 2012;31(2):97-145.
9. Kondrup J, Allison SP, Elia M, Vellas B, Plauth M. ESPEN guidelines for nutrition screening 2002. Clin Nutr 2003;22(4):415-21.
10. Kaiser MJ, Bauer JM, Ramsch C, et al. Validation of the Mini Nutritional Assessment Short-Form(MNA®-SF): A practical tool for identification of nutritional status. J Nutr Health Aging. 2009;13: 782-788
11. Chandra, R.K. Nutrition and the immune system: an introduction. Am. J. Clin. Nutr. 1997, 66, 460S-463S.
12. Holmes, S. The effects of undernutrition in hospitalised patients. Nurs. Stand. 2007, 22, 35-38.
13. Kubrack, C.; Jensen, L. Malnutrition in acute care patients. Int. J. Nurs. Stud. 2007, 44, 1036-1054.
14. Allison, S.P. Malnutrition, disease and outcome. Nutrition 2000, 16, 590-593.
15. Braunschweig, C.; Gomez, S.; Sheean, P.M. Impact of declines in nutritional status on outcomes in adult patients hospitalized for more than 7 days. J. Am. Diet. Assoc. 2000, 100, 1316-1322
16. Thomas, D.R.; Zdrowski, C.D.; Wilson, M.-M.; Conright, K.C.; Lewis, C.; Tariq, S.; Morley, J.E. Malnutrition in subacute care. Am. J. Clin. Nutr. 2002, 75, 308-313.
17. Kruizenga, H.M.; Tulder, M.W.V.; Seidell, J.C.; Thijs, A.; Ader, H.J.; van Bokhurst-de van der Schueren, M.A.E. Effectiveness and cost-effectiveness of early screening and treatment of malnourished patients. Am. J. Clin. Nutr. 2005, 82, 1082-1089.
18. Middleton, M.H.; Nazarenko, G.; Nivison-Smith, I.; Smerdely, P. Prevalence of malnutrition and 12-month incidence of mortality in two Sydney teaching hospitals. Int. Med. J. 2001, 31, 455-461.
19. J. Álvarez-Hernández , M. Planas Vila , M. León-Sanz , A. García de Lorenzo , S. Celaya-Pérez , P. García-Lorda , K. Araujo , B. Sarto Guerri. Prevalence and costs of malnutrition in hospitalized patients; the PREDyCES® Study. Nutr Hosp. 2012; 27(4):1049-1059
20. Ulibarri JI, Burgos R, Lobo G, Martínez MA, Planas M, Péres de la Cruz A, et al. Recomendaciones sobre la evaluación del riesgo de desnutrición en los pacientes hospitalizados. Nutr Hosp 2009; 24(4): 467-472
21. Donini LM, Savina C, Rosano A, De Felice MR, Tassi L, De Bernardini L, et al. MNA predictive value in the follow-up of geriatric patients. J Nutr Health Aging 2003;7(5):282-93.
22. Van Nes MC, Herrmann FR, Gold G, Michel JP, Rizzoli R. Does the Mini Nutritional Assessment predict hospitalization outcomes in older people? Age Ageing 2001;30(3):221-6.
23. Lisa Söderström a,b,*, Andreas Rosenblad a,d, Eva Thors Adolfsson a,e, Anja Saletti b, f,Leif Bergkvist. Nutritional status predicts preterm death in older people: A prospective cohort study. Clinical Nutrition 33 (2014) 354-359
24. Charlton K, Nichols C, Bowden S, Milosavljevic M, Lambert K, Barone L, et al. Poor nutritional status of older subacute patients predicts clinical outcomes and mortality at 18 months of follow-up. Eur J Clin Nutr 2012;66(11):1224-8
25. Holst M, Yifter-Lindgren E, Surowiak M, Nielsen K, Mowe M, Carlsson M, et al. Nutritional screening and risk factors in elderly hospitalized patients: association to clinical outcome? Scand J Caring Sci. 2013 Dec;27(4):953-61


