S. Hormozi1, M. Alizadeh-Khoei2,1, F. Sharifi1, M. Chehrehgosha3, R. Esmaeili4, F. Rezaie-Abhari5, R. Aminalroaya2, Z. Madadi1
1. Elderly Health Research Center, Endocrinology and Metabolism Population Sciences Institute, Tehran University of Medical Sciences, Tehran, Iran;
2. Gerontology & Geriatric Department, Medical School, Tehran University of Medical Sciences, Tehran, Iran; 3. Gerontology Department, University of Social Welfare and Rehabilitation Sciences, Tehran, Iran ; 4. Orthopedic Research Center, Mazandaran University of Medical Sciences, Sari, Iran; 5. Midwifery Department, Nursing and Midwifery School, Mazandaran University of Medical Sciences, Sari, Iran
Corresponding Author: Dr. Mahtab Alizadeh-Khoei, Associated professor of clinical gerontology, Medical school Tehran University of Medical Sciences, and Elderly Health Research Center, Endocrinology and Metabolism Population Sciences Institute, Tehran, University of Medical Sciences, Tel.: +98-21-88220085, Email: alizadeh-m@sina.tums.ac.ir , mahtabalizadeh@yahoo.com
J Aging Res Clin Practice 2019;8:74-79
Published online October 7, 2019, http://dx.doi.org/10.14283/jarcp.2019.13
Abstract
Abstract: Background: Since malnutrition of geriatric hospitalized patients has an impact on treatment and care management, the aim was to define the accuracy of Malnutrition Universal Screening Test (MUST) for malnutrition screening in the Iranian hospitalized elderly. Methods: In this cross-sectional study elderly 60 ≥ years (N= 192) were selected from two hospitals, anthropometric measures (BMI, MAC, and CC), laboratory test (Albumin), and nutrition tool (Full-MNA) applied and analyzed at P<0.05 level. Results: Elderly participants had a mean age of 68.86 ± 7.46 years and BMI 24.08± 4.64. Elderly patients (28%) lost their weight (>10%) in the last six months and loss of appetite observed in (33.4%) participants. In MUST tool rating, high-risk elderly patients for malnutrition were 33.3%. The AUC for MUST, according to Full-MNA was obtained 90.41%, with sensitivity 90.0% and specificity 73.25%. The MUST showed the strongest correlation with Full-MNA (r = -0.7) and BMI (r = – 0.51); but, the lowest correlation observed with Alb (r= -0.274). Most AUC was belonging to weight loss (0.96) and BMI (0.94). NConclusion: The MUST tool like full-MNA could diagnose malnutrition in geriatric patients in the hospital setting.
Key words: Iranian elderly, Validity, Malnutrition, Hospital, Full-MNA, MUST.
Introduction
Malnutrition in elderly hospitalized patients is often was neglected, because of less priority of malnutrition disorders comparing to other geriatric problems, lack of clinical knowledge in applying appropriate screening tools, and time limitation for staff in geriatric units (1). Older adults due to more hospitalization for illness, injuries, and surgeries, are more at risk of malnutrition that made a loss of Lean Body Mass (LBM). According to a correlation between malnutrition and clinical outcomes, appropriate nutritional screening in the hospital should be done at admission time for geriatric patients by applying validated screening tools (2). Mini Nutritional Assessment (MNA) and Malnutrition Universal Screening Tool (MUST) as valid nutritional screening tools have similarities (3), both need more time to fill and calculating, but MUST tool gives a better estimation for patient’s nutritional status (4)
The MUST tool designed to identify elderly nutritional needs in treatments and finding the correlation between malnutrition statuses and impaired functions (4, 5), also can predict the clinical outcomes in geriatric patients, according to the length of stay in the hospital, and re-hospitalization. Moreover, it’s a subjective clinical instrument that could score with any general expertise (5).
Since the MUST, in comparison with the other nutritional tools is a specific instrument in hospitals to malnutrition screening, our aims were the validity of the Iranian version MUST to detect malnutrition in hospitalized elderly and to discriminate the risk of malnutrition in malnourished geriatric patients.
Materials and Methods
Participants
This study was designed to risk assessment of malnutrition in hospitalized elderly in two general hospitals in Tehran capital city of Iran as a cross-sectional validation study from October 2018 to March 2019. According to inclusion and exclusion criteria and by using a simple random sampling method, a total of 192 elderly patients aged ≥ 60 years, were enrolled in this study. The inclusion criterion was the ability to communicate verbally and participate in an interview. Elderly patients were assessed by a trained nurse and a nutritionist in those hospitals. From all participants were asked to declare if been willing to participate in this study, then only, who filled consent form were included. Also, Patients’ rights and information confidentiality were considered.
All participants from the point of view mental illness, severe cognitive impairment by Mini-Mental State Examination (MMSE) <23 (6), depression by Geriatric Depression Scale (GDS-15) ≥8 (7), dysphasia, blindness, deafness, terminal illness, confusion, unconsciousness, emergency situations, and inability to give informed consent were evaluated. Bedridden patients or amputation were excluded from the study, due to a limitation in weight measuring.
The project approved by the ethics Committee of Endocrinology and Metabolism Research Institute (EMRI) Tehran University of Medical Sciences (project number EC-1613-00305). In addition, Helsinki statement and the Iranian Ministry of Health and Medical Education guidelines considered in.
Translation process
After permission from the developer, the English version of Malnutrition Universal Screening Tool (MUST) was translated into the Persian language in accordance International Quality of Life Questionnaire (IQOLA) protocol (8). Then, two native Persian translators who were professional in English translated the English version into the Persian language separately, and then in a common reviewing session, they reached an agreement with the two translated texts to the final version tool.
To determine the difficulty in insertion items in the questionnaire, a verified Persian version was given to 10 educated elderly and their informal caregivers, based on 100-mm Linear Analog Scale Assessment (LASA).
The score of 100 represented “Most difficulty “and zero scores “No difficulty” to understand the questions. The mean difficulty accepted level was ≤ 30 scores in the questionnaire. Then, quality of translation in three domains (clarity, the common language applied, and conceptual equivalence) was rated by the two other translators. The quality ≥ 60 scores for each three domain were acceptable (8). Then, the two other translators performed a backward translation. Finally, the backward translation and original English version of MUST were compared through another English specialist.
Data collection
Anthropometry measures were performed for each patient, based on Body Mass Index (BMI), Mid Arm Circumference (MAC), Calf Circumference (CC), waist, full- MNA, and blood test (serum albumin). Some demographic data (age, sex, and medical conditions) and Malnutrition Universal Screening Tool (MUST) were gathered in hospital visits from patients for malnutrition risk assessment (5).
Patients’ weight measures were done with the least possible clothes, without shoes by means of SECA (880 to kg in the nearest decimals)(9). The height was assessed by a portable and freestanding stadiometer, based on the standard method (3). For assessing nutritional status, the unintentional weight loss during last month and the previous 6 months were asked from geriatric patients. Then, the percentage of unintentional weight loss was calculated based on patient reports.
The severity of malnutrition is defined according to one or more following conditions; BMI <18.5 (5, 9), Unwanted weight loss around 5% over the past month and 10% over the past 6 months (9). So, if patients had 5-10% unwanted weight loss within the last six months, they were moderately malnourished (5). If patients were in the age group <65, with BMI >20 or in aged group ≥65 with BMI >22 and had an unintentional weight loss <5% in the last 6 months were considered at risk of malnutrition. Weight loss percentage would use to indicate acute malnutrition, whereas, low BMI would consider as chronic malnutrition (2, 3).
The MAC was measured by a flexible, non-stretched tape to the nearest 0.1 cm, between acromion and olecranon process on the non-dominant arm (10). Serum albumin was evaluated as a blood biomarker of nutritional status with albumin Test Kit (Pars albumin Test Kit, Auto-analyzer, Hitachi 902, Japan), with cutoff level < 3.5 g/DL was considered as malnutrition (10).
Nutritional anthropometric assessment
The applied tools to determine the risk of malnutrition were included full-MMA (3) and MUST.
Malnutrition Universal Screening Tool (MUST)
The MUST is a malnutrition screening tool in geriatric patients in the hospital setting. The MUST measures the BMI status, unintentional weight loss around 5 -10% in previous 3-6 months, and acute illness in a patient, who could not eat over 5 consecutive days. Comparing to the others is an easy tool, has high reliability to detect protein-energy malnutrition and could predict the risk of malnutrition incidence in the future (5).
The maximum MUST score is 6, where 0 point indicates low risk, score =1 as moderate risk, and score ≥ 2 indicates a high risk of malnutrition(11).
Statistical analysis
Descriptive statistics and cross-tabulations were used for diagnostic accuracy in terms of sensitivity, specificity, Positive Predictive Value (PPV), Negative Predictive Value (NPV), and likelihood ratios. The MUST Spearman’s rank correlation coefficients with full-MNA, serum albumin, and BMI considered as a criterion validity to the MUST.
Confidence Intervals (CI) were calculated in 95%. All analyses were considered statistically significance at α < 0.05 levels and performed by STATA 12.
To accuracy in diagnosing of malnutrition in the hospitalized Iranian elderly and compared with the Persian version of full-MNA, we integrated three MUST subgroups to the two subgroups: the one group as low risk and the other as moderate and high risk for malnutrition.
Meanwhile, we integrated the two subgroup of MNA tool: one group as a well-nourished, and the other as Malnutrition and at risk for malnutrition(12, 13). In this study, cut-off points for MUST, full-MNA, BMI, MAC, and CC indices were based on Doroudi., et al., study (28) albumin cut-off point based on Kuzuya et al., study(10).
Results
A total of 192 patients with mean age 68.86 ± 7.46 years and BMI 24.08± 4.64 studied. Weight loss>10% in the last six months, was observed only in 28% of geriatric inpatients, and loss of appetite were 33.4% (N=32) in the participants. Other characteristics of the elderly participants reported in [Table 1].
MUST: Malnutrition Universal Screening Tool, MNA: Mini Nutritional Assessment, BMI: Body Mass Index; MAC: Mid-Arm Circumference; CC: Calf Circumference; *MUST, MNA,BMI, MAC, CC categorized based on Doroudi., et al study (33); **Alb: categorized based on Kuzuya., et al study (32)
According to the rating of MUST, low-risk patients for malnutrition were 34.4% and high-risk elderly patients for malnutrition were 33.3%. While elderly patients 44.8% were well-nourished with the full-MNA tool and 37.5% were at risk for malnourishment. Diagnostic accuracy MUST instrument, according to full-MNA was 83.3%, with sensitivity 90.0% and specificity 73.25% [Table 2].
The correlation of total MUST score with full-MNA scores, anthropometrical measurements (BMI, MAC, and CC), and serum albumin presented in [Table 3]. The MUST tool were correlated with full-MNA (r=-0.7), and with BMI (r=- 0.51); moreover, the lowest correlation (r=-0.274) observed with Albumin.

Table 3
Correlations between the Iranian version MUST and full-MNA score, anthropometric measurements, and clinical parameter
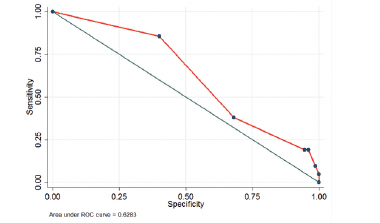
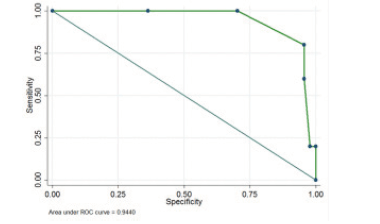
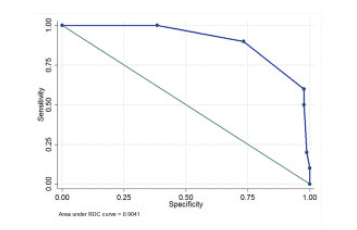
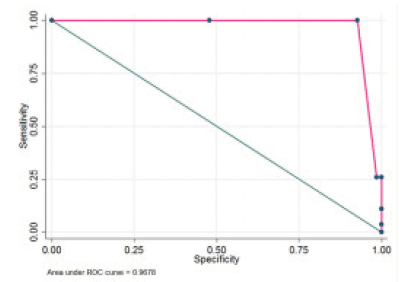
In ROC curve analysis and anthropometric measurements (BMI), clinical parameter (serum albumin), and full-MNA assessing was not found a cut-off point to MUST tool. The highest sensitivity was obtained in weight loss >10%, BMI<18.5, full-MNA<17, and Alb <3.5, respectively. The highest AUC were belong to weight loss (0.96; 95%CI, 0.94 – 0.98) and BMI (0.94; 95%CI, 0.89 – 0.98) [Fig1].
Figure 1
ROC curve of the Iranian version MUST with MNA, BMI, Alb, Weight loss as criteria for malnutrition detection
a. ROC MUST by Alb
Discussion
In validation study of the Iranian version MUST tool observed the strongest correlation with Full-MNA and BMI but, the lowest correlation observed with Alb. Most AUC was belonging to weight loss and BMI in hospitalized geriatric patients.
A benefit of MUST tool is potential use in nutrition counseling in high-risk geriatric patients and patients’ evaluating with a moderate risk of malnutrition after hospital admission (13).
The MUST tool has applied in cancer patients validation studies (12, 14) and used also for screening patients in different settings (Intensive Care Unit) in other researches (15, 16).
Since validity measurement of a tool cannot be carefully evaluated (15) (), we used several criteria. To prevent feasible errors in use BMI, the other criteria (MAC, CC, full-MNA, and weight loss 3-6 month) and serum albumin, also used to determine sensitivity and specificity as the gold standard to MUST tool in hospitalized elderly. Same as other studies, we also used BMI as a measure of disease-related malnutrition, which is a gold standard to determine under-nutrition in hospitalized elderly patients (10, 16). Results of the present study showed BMI had a high correlation with the MUST malnutrition screening tool same as Zhang study (17); although in reports by Van Tonder, et al., in hospitalized adult patients in South African, there was no significant relationship between BMI and MUST (18). Meanwhile in Intensive Care Unit (ICU) hospitalized elderly, Carvalho et al., (2017) were not observed statistical differences, based on MUST, BMI, and serum albumin between survivors’ elderly patients and non-survivors. As a gold standard, nutritional screening tool (BMI) viewed as important numerical scale and score indicator for nutritional status. Although, there are the other variables also that could be affected by objectivity and quantity, especially in the elderly population; therefore, differences in research results might be, due to variations in clinical settings (outpatients, hospitalization, and nursing homes) (14)
Evaluating of serum albumin for malnutrition screening in hospitalized elderly patients has been reported in some studies. Serum albumin level is a key measurement in protein-energy malnutrition in elderly patients; although, there is still ambiguity about this issue (10).
It should be noted that serum albumin level is often altered in elderly patients with non-nutritional factors such as inflammation, capillary leakage, liver disease, and hydration (14) so, serum albumin interpretation as a malnutrition risk factor would be difficult in elderly patients. According to a study in frail hospitalized patients (19), reported no relationship between albumin and MUST score; our results, also found a weak correlation between the patient’s albumin level and MUST tool. In assessing malnutrition in geriatric hospitalized patients, also a significant difference in albumin between malnutrition group and well-nourished with MUST was reported (2). Serum proteins (albumin and pre-albumin) measuring are widely used by physicians to determine patients’ nutritional status. However, recently the focus is more on physical examination to diagnosis malnutrition in older patients, and since the clinical tests are not reliable alone, should be used them as a compliment with a physical examination by a screening tool (20).
Due to comprehensive geriatric approach to distinguish between malnourished older patients, and at risk of malnutrition, the full-MNA tool could be helpful as one of the MUST validation criteria in the hospital setting (3). The results in present study showed that full-MNA have the best correlation with the MUST. In assessing nutritional status in nursing homes, Doninital et al., reported “Fair” agreement (21) between MNA and MUST (k = 0.270; P< .001). In another study to assess the nutritional status of elderly women with three evaluation tools (MNA, MNA-SF, and MUST), a “Good” agreement between the nutritional assessment tools was reported. Although in a study on elderly nursing home residents in Nuremberg (22) Kappa agreement between MNA and MUST was reported low (κ = 0.16), that might be, due to differences in aged care settings and special conditions in elderly patients.
Malnutrition screening in the older population, due to being heterogeneous group is difficult; meanwhile, disease processes (spinal cord degeneration, edema, infections, and inflammation) can often affect the assessment of malnutrition; therefore, screening approaches before care can be beneficial (23). On the other hand, nutrition screening tests should be able to determine not only the caloric intake but could also determine the severity and possible causes of malnutrition (2), which both MUST and full-MNA tools include this feature.
The anthropometric measurements (CC and MAC) was proposed by Bonnefoy et al., as a relevant parameters to assess nutritional status and malnutrition prediction in hospitalized elderly patients who are require regular monitoring (24). In our study, there was no correlation between CC and MAC with MUST tool; but, Baek and Heo (2015) reported significant differences in MAC and CC parameters with the MUST screening tool, between the two groups (malnutrition and well nourished) in hospitalized geriatric patients (2).
In under-nutrition status, in the low level of metabolism in tissues (subcutaneous fat and skeletal muscle) usually catabolizing increased, that made decreasing MAC more than BMI. Since high infection or severe malnutrition status in both healthy and sick people make increasing catabolism in skeletal muscles (25); so distinguishing between decreased MAC due to malnutrition or disease would be difficult. Therefore, an effective, validated, and practical nutritional screening tool should be fast and simple to facilitate the proper patient’s referral to a nutritionist(3).
In assessing MUST tool, in this study, sensitivity and specificity were observed, with the four criteria (full-MNA, Alb, BMI, and weight loss in the past 3-6 month). Same to our findings, Beak and Heo (2015) also has reported a “Good” validity (sensitivity 80.6% and specificity 98.7%) with the MUST (2); but, we could not find any study to determine the MUST validation with our used measurements (Alb, BMI, and weight loss in past 3-6 month).
In ROC curve analysis with anthropometric measurement (BMI), clinical parameter (serum albumin), and full-MNA, we have not found a cut-off point for the MUST tool. The other similar studies (Floor Neelemaa, 2011 ; Myoung-Ha Baek, 2015 ; Daradkeh, 2018) also have not found a ROC curve (2).
From view the strength, this is the first study to measure the applicability of MUST tool with different anthropometric measurements (MAC, CC, and full-MNA)(16) and blood criterion (albumin), also in both applied screening tools; the self-report method was not used. The major our limitation was the lack of assessing the elderly patients in both admission and discharge times for gathering nutritional parameters’ information during a hospital stay. Moreover, because of the cross-sectional nature of this research, we could not identify malnutrition outcomes in malnourished subjects and the impact of malnutrition outcomes in re-hospitalization and length of hospital stay.
Conclusion
It seems the MUST tool need a shorter time than the full-MNA and like as full-MNA could be effective in the assessment of nutritional status in elderly hospitalized patients, could distinguish patients at risk of malnutrition from severe malnutrition in hospitalized elderly. Besides, applying anthropometric measures (BMI) and blood measure (serum albumin) recommended at the same time. For further studies, we suggest that the accuracy of the MUST tool in patients undergoing re-admission and the effect of the length of stay of the elderly patient in hospitals should be evaluated.
Funding: This study was supported by Endocrinology and Metabolism Research Institute of Tehran University of Medical Sciences with grant number [1613-99-01-2015].
Acknowledgments: The authors would like to thank contributions of all the patients and members of the team (dieticians, nurses and medical staffs) would appreciate in interviewing with patients.
Conflict of interest statement: The authors state, they have no conflict of interest.
Ethical standard: The study was carried out respecting all applicable confidentiality rules.
References
1. Waitzberg DL, Caiaffa WT, Correia MI. Hospital malnutrition: the Brazilian national survey (IBRANUTRI): a study of 4000 patients. Nutrition (Burbank, Los Angeles County, Calif). 2001;17(7-8):573-80.
2. Baek MH, Heo YR. Evaluation of the efficacy of nutritional screening tools to predict malnutrition in the elderly at a geriatric care hospital. Nutrition research and practice. 2015;9(6):637-43.
3. Young AM, Kidston S, Banks MD, Mudge AM, Isenring EA. Malnutrition screening tools: comparison against two validated nutrition assessment methods in older medical inpatients. Nutrition (Burbank, Los Angeles County, Calif). 2013;29(1):101-6.
4. van Bokhorst-de van der Schueren MA, Guaitoli PR, Jansma EP, de Vet HC. Nutrition screening tools: does one size fit all? A systematic review of screening tools for the hospital setting. Clinical nutrition (Edinburgh, Scotland). 2014;33(1):39-58.
5. Stratton RJ, Hackston A, Longmore D, Dixon R, Price S, Stroud M, et al. Malnutrition in hospital outpatients and inpatients: prevalence, concurrent validity and ease of use of the ‘malnutrition universal screening tool’ (‘MUST’) for adults. The British journal of nutrition. 2004;92(5):799-808.
6. Ansari NN, Naghdi S, Hasson S, Valizadeh L, Jalaie S. Validation of a Mini-Mental State Examination (MMSE) for the Persian population: a pilot study. Applied neuropsychology. 2010;17(3):190-5.
7. Malakouti SK, Fatollahi P, Mirabzadeh A, Salavati M, Zandi T. Reliability, validity and factor structure of the GDS-15 in Iranian elderly. International journal of geriatric psychiatry. 2006;21(6):588-93.
8. Fukuhara S, Bito S, Green J, Hsiao A, Kurokawa K. Translation, adaptation, and validation of the SF-36 Health Survey for use in Japan. Journal of clinical epidemiology. 1998;51(11):1037-44.
9. Neelemaat F, Kruizenga HM, de Vet HC, Seidell JC, Butterman M, van Bokhorst-de van der Schueren MA. Screening malnutrition in hospital outpatients. Can the SNAQ malnutrition screening tool also be applied to this population? Clinical nutrition (Edinburgh, Scotland). 2008;27(3):439-46.
10. Kuzuya M, Izawa S, Enoki H, Okada K, Iguchi A. Is serum albumin a good marker for malnutrition in the physically impaired elderly? Clinical nutrition (Edinburgh, Scotland). 2007;26(1):84-90.
11. Rasheed S, Woods RT. Predictive validity of ‘Malnutrition Universal Screening Tool’ (‘MUST’) and Short Form Mini Nutritional Assessment (MNA-SF) in terms of survival and length of hospital stay. e-SPEN Journal. 2013;8(2):e44-e50.
12. Boleo-Tome C, Monteiro-Grillo I, Camilo M, Ravasco P. Validation of the Malnutrition Universal Screening Tool (MUST) in cancer. The British journal of nutrition. 2012;108(2):343-8.
13. Sharma Y, Thompson C, Kaambwa B, Shahi R, Miller M. Validity of the Malnutrition Universal Screening Tool (MUST) in Australian hospitalized acutely unwell elderly patients. Asia Pacific journal of clinical nutrition. 2017;26(6):994-1000.
14. Chao PC, Chuang HJ, Tsao LY, Chen PY, Hsu CF, Lin HC, et al. The Malnutrition Universal Screening Tool (MUST) and a nutrition education program for high risk cancer patients: strategies to improve dietary intake in cancer patients. BioMedicine. 2015;5(3):17.
15. Power L, Mullally D, Gibney ER, Clarke M, Visser M, Volkert D, et al. A review of the validity of malnutrition screening tools used in older adults in community and healthcare settings – A MaNuEL study. Clinical nutrition ESPEN. 2018;24:1-13.
16. Leistra E, Langius JA, Evers AM, van Bokhorst-de van der Schueren MA, Visser M, de Vet HC, et al. Validity of nutritional screening with MUST and SNAQ in hospital outpatients. European journal of clinical nutrition. 2013;67(7):738-42.
17. Zhang Z, Pereira SL, Luo M, Matheson EM. Evaluation of Blood Biomarkers Associated with Risk of Malnutrition in Older Adults: A Systematic Review and Meta-Analysis. Nutrients. 2017;9(8).
18. van Tonder E, Gardner L, Cressey S, Tydeman-Edwards R, Gerber K. Adult malnutrition: prevalence and use of nutrition-related quality indicators in South African public-sector hospitals. South African Journal of Clinical Nutrition. 2019;32(1):1-7.
19. Slee A, Birch D, Stokoe D. The relationship between malnutrition risk and clinical outcomes in a cohort of frail older hospital patients. Clinical nutrition ESPEN. 2016;15:57-62.
20. Bharadwaj S, Ginoya S, Tandon P, Gohel TD, Guirguis J, Vallabh H, et al. Malnutrition: laboratory markers vs nutritional assessment. Gastroenterology report. 2016;4(4):272-80.
21. Donini LM, Poggiogalle E, Molfino A, Rosano A, Lenzi A, Rossi Fanelli F, et al. Mini-Nutritional Assessment, Malnutrition Universal Screening Tool, and Nutrition Risk Screening Tool for the Nutritional Evaluation of Older Nursing Home Residents. Journal of the American Medical Directors Association. 2016;17(10):959.e11-8.
22. Diekmann R, Winning K, Uter W, Kaiser MJ, Sieber CC, Volkert D, et al. Screening for malnutrition among nursing home residents – a comparative analysis of the mini nutritional assessment, the nutritional risk screening, and the malnutrition universal screening tool. The journal of nutrition, health & aging. 2013;17(4):326-31.
23. Green SM, Watson R. Nutritional screening and assessment tools for older adults: literature review. Journal of advanced nursing. 2006;54(4):477-90.
24. Bonnefoy M, Jauffret M, Kostka T, Jusot JF. Usefulness of calf circumference measurement in assessing the nutritional state of hospitalized elderly people. Gerontology. 2002;48(3):162-9.
25. Collins S. Using middle upper arm circumference to assess severe adult malnutrition during famine. Jama. 1996;276(5):391-5.

