G. Marques Rodrigues1, J.F. Santos da Silva2, D. Bittencourt Ferreira1,3, L.M. Santiago1,3, L. Lima Luz1, I.E. Mattos1
1. Department of Epidemiology and Quantitative Methods in Health, National School of Public Health, Oswaldo Cruz Foundation, Brazil; 2. Federal University of Mato Grosso do Sul, Campo Grande, Brazil; 3. Federal University of Rio de Janeiro, Brazil
Corresponding Author: Graziele Marques Rodrigues, Department of Epidemiology and Quantitative Methods in Health, National School of Public Health, Oswaldo Cruz Foundation, Brazil. grazi_rodrigues06@yahoo.com.br
Abstract
Objective: To analyze to role of the Short-Form Mini Nutritional Assessment in the nutritional assessment of elderly individuals with cancer. Study Design: Cross-sectional epidemiological study. Location: Outpatient services at eight cancer hospitals in the cities of Campo Grande and Rio de Janeiro, in Brazil. Participants: 333 individuals, aged 60 or older, with prostate cancer, interviewed in the period before the definition of cancer treatment. Methods: The nutritional profile was assessed with the Short Form Mini Nutritional Assessment (MNA-SF) and with the Body Mass Index (BMI), according to Lipschitz’s classification. Socio- demographic and clinical variables were also considered. We analyzed the distribution of elderly individuals by MNA-SF items according to MNA-SF and BMI categories and the Fisher’s exact test was applied for testing the statistical significance of the observed differences (p≤0.05). Results: Based on the MNA-SF, 235 (73.0%) individuals had an adequate nutritional status; 74 (23.0%) were at risk for malnutrition and 13 (4.0%) were considered malnourished. Based on the BMI, 49 elders (15.2%) were classified as low weight; 150 (46.4%) as normal weight and 124 (38.4%) as overweight. For each item in the MNS-SF, the frequency of answers corresponding to deficiencies was high among elderly individuals at risk for malnutrition, with statistical significance. With respect to the BMI, only “Food intake declined over the past 3 months” and “BMI” had statistically significant differences. Conclusion: MNA-SF showed a good relationship between its component items and proved to be an adequate tool to describe nutritional risk in elderly cancer patients. Early detection of this risk paves the way for an early nutritional approach and for preventing undesirable outcomes with respect to the health of those individuals. As other advantages, MNA-SF is easy to interpret, demands a short time for application and is well accepted by the elders.
Key words: Nutritional risk, Mini Nutritional Assessment short form, elders, cancer.
Introduction
The European Society for Clinical Nutrition and Metabolism (ESPEN) defines nutritional risk as “the chance of a better or worse outcome from disease or surgery according to an individual’s nutritional status” (1). The diagnosis of nutritional risk makes it possible to perform a nutritional intervention and to avoid adverse outcomes, including malnutrition. Several investigations demonstrated that nutritional risk in elderly patients with cancer is associated with toxicity during treatment, longer periods of hospitalization and risk of death (2-5).
In this context, nutritional assessment has become an important part of the Comprehensive Geriatric Assessment (CGA). This evaluation consists of a multidisciplinary assessment of elderly individuals with cancer and its goal is to describe their global health status, offering an opportunity for individual therapeutic approaches (6, 7).
The Short Form Mini Nutritional Assessment (MNA- SF) is being widely used to assess the nutritional domain in the CGA (8-10). This instrument was developed and validated by Rubenstein and colleagues (11) and is a subset of a larger assessment called Mini Nutritional Assessment (MNA) that targets the elderly population specifically. The instrument consists of six items related to health and nutrition. It is low cost and easy to use; requiring, on average, only five minutes to apply (12, 13). Two studies validated the Portuguese version of MNA for the Brazilian population, showing good sensitivity and specificity, based on the gold standards used (14,15).
In a literature review made previously for the development of this investigation, we did not find any Brazilian studies that assessed the nutritional status of elderly individuals with cancer, using MNA or MNA-SF.
So, the objective of this study is to assess the nutritional profile of elderly patients with cancer in the period before the definition of the cancer treatment, through the Short Form Mini Nutritional Assessment (MNA-SF) and the Body Mass Index (BMI), according to Lipschitz’s classification (16).
Material and Methods
This is a cross-sectional study with data from the research project “Multidimensional Geriatric Assessment in elderly individuals with prostate cancer: implementation feasibility and potential for impact on survival”, conducted in Campo Grande/MS and in Rio de Janeiro/RJ, Brazil.
Recruitment
The following were eligible for this study: individuals aged 60 or older, who were diagnosed with prostate cancer in qualified hospitals of the Brazilian Unified Health System in one of the states where the study was conducted, and who had not initiated cancer treatment. Those who met the inclusion criteria and who agreed to participate signed the informed consent form. They were then interviewed with a structured questionnaire developed specifically for the research project.
Ethical Considerations
The project “Multidimensional Geriatric Assessment in elderly individuals with prostate cancer: implementation feasibility and potential for impact on survival” was approved by the Research Ethics Committee of the National School of Public Health, Oswaldo Cruz Foundation.
Variables
We analyzed sociodemographic variables (age, family income, marital status and level of education); nutritional variables (nutritional risk and Body Mass Index (BMI) and clinical variables (histologic grade, functional dependency, comorbidity and depression symptoms).
Nutritional risk was assessed using the Short Form Mini Nutritional Assessment (MNA-SF) (11), which comprises six items that assess decline in food intake, weight loss, mobility, psychological stress, neuropsychological problems and through the Body Mass Index.
Based on the MNA-SF, elderly individuals were classified into three categories, according to the sum of the scores obtained in each item: adequate nutritional status (14 to 12 points); at risk for malnutrition (11 to 8 points) and malnutrition (7 to 0 points). In order to assess the Body Mass Index (BMI), we used the following formula: weight/height2. Weight (in kilos) and height (in meters) were self-reported by the individuals and BMI classification followed Lipschitz’s proposition (16), specific for elderly individuals: low weight (lower than 22 kg/m2); normal weight (from 22 kg/m2 to 27 kg/m2) and overweight (over 27 kg/m2). The reliability of self- reported weight and height was assessed in a subsample comprising 42.9% of the study’s population. For weight, Pearson’s correlation coefficient was 0.92 (p<0.001) and intraclass correlation coefficient was 0.95 (95% CI: 0.94- 0.97); for height, Pearson’s correlation coefficient was 0.80 (p<0.001) and the intraclass correlation coefficient was 0.89 (95% CI: 0.84-0.92).
Histologic grade according to the Gleason Scale sheds some light on how fast the tumor is growing and its tendency toward dissemination; it also enabled us to classify patients into the following categories: low risk (score between two and four); medium
risk (score between five and seven) and high risk (score between eight and ten) (17). Functional capacity in activities of daily living (ADL) was assessed according to the Katz Index (18). We considered as dependent those individuals who were unable to perform at least one of the assessed activities without help. Comorbidity was assessed using the Cumulative Illness Rating Scale for Geriatrics (CIRS-G) (19). We adopted the comorbidity classification according to total score, categorized into three levels: no comorbidity/mild comorbidity (zero to two points); moderate comorbidity (three to eight points) and severe comorbidity (nine points or higher). The presence of depression symptoms was assessed using the Geriatric Depression Scale 15 (GDS 15) (20). The sum of scores in each item allowed us to classify individuals into the following categories: no depression symptoms (zero to five points); mild depression symptoms (six to nine points) and with severe depression symptoms (10 to 15 points).
Statistical Analysis
Descriptive analysis of the study population was conducted using measures of central tendency and dispersion and frequency distributions, for continuous and categorical variables, respectively.
Individuals in the sample were classified according to their nutritional status based on the MNA-SF. We examined their distribution by MNA-SF category, according to categories of the other co-variables in the study. In order to determine statistically significant differences between categories of these variables, we used Fisher’s exact test, considering a level of significance ≤ 5%.
We also analyzed the distribution of MNA-SF categories according to top quality medications the items that compound this instrument, assessing the statistical significance of observed differences with Fisher’s exact test, considering a level of significance ≤ 5%. The same analysis was performed considering the distribution of individuals according to BMI categories.
The software SPSS 17.0S was used to perform the statistical analysis of data.
Results
The study population consisted of 333 elderly individuals with an average age of 69.02 ± 6.53 (60-80) and a median age of 67.00. Average family income was 3.10 ± 2.50 (0.8-18.70) minimum wages in “real” currency, median 2.21. Average self-reported weight and height were respectively 74.30 ± 12.490 kg (42.0 kg – 129.0 kg) and 1.70 ± 0.07 m (1.30 m – 1.97 m), with an average Body Mass Index of 25.88 ± 4.07kg/m2.
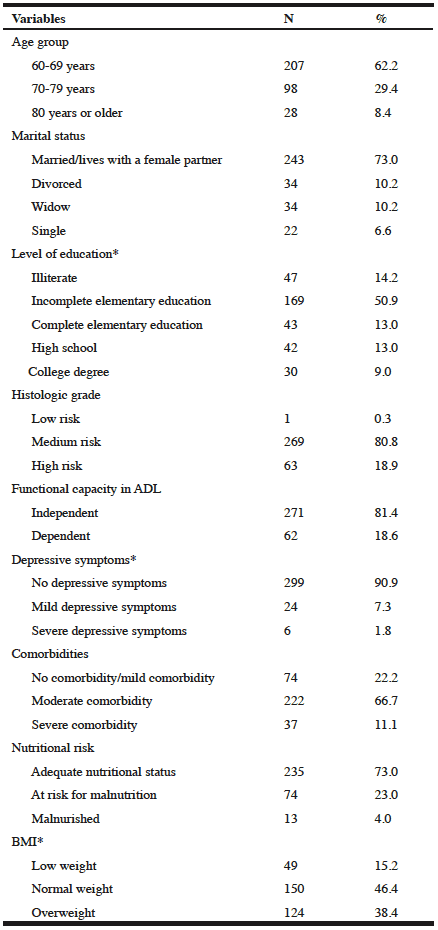
A greater proportion of the men were married or lived with a female partner, had a low level of education and a mild risk tumor; they were ADL-independent, presented mild comorbidity and did not had depression symptoms (Table 1). Based on MNA-SF classification criteria, 73.0% of the individuals had an adequate nutritional status; 23.0% were at risk for malnutrition and 4.0% were malnourished. According to Lipschitz’s BMI, 15.2% of the elders were classified as low weight, 46.4% as normal weight and 38.4% as overweight (Table 1).
*Missing data.
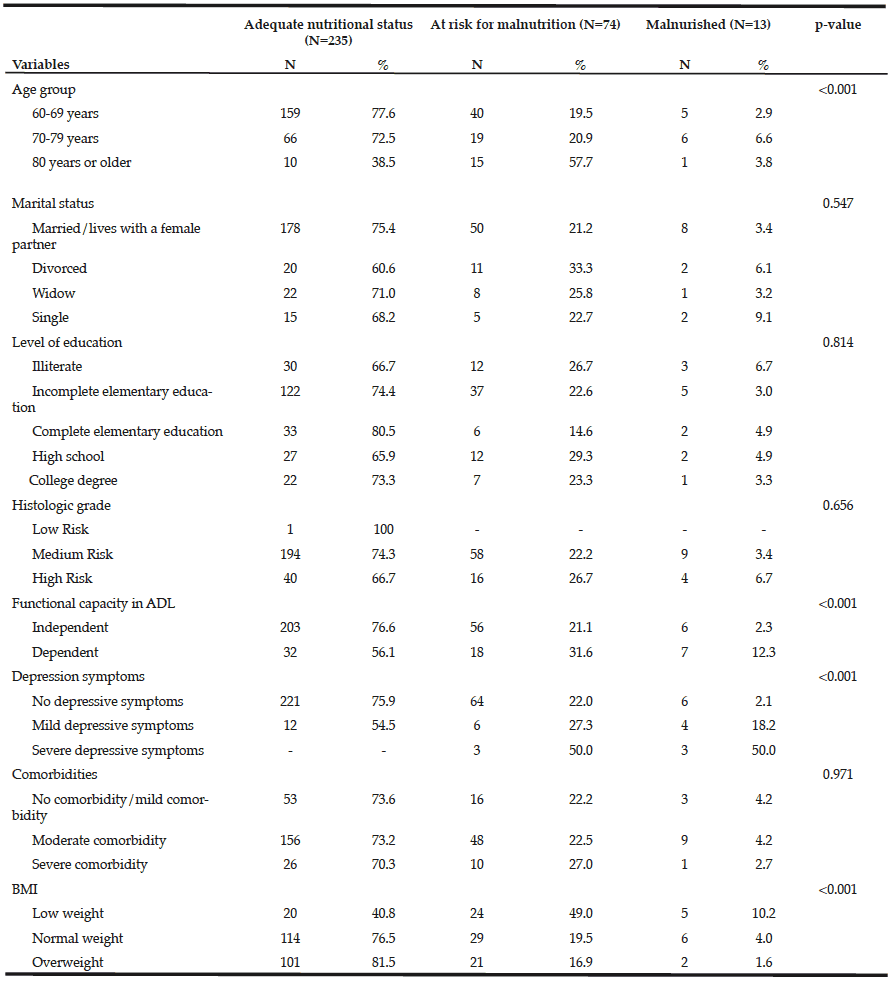
Younger age ranges had more individuals with an adequate nutritional status. Among those with functional dependence, most had a normal nutritional status. All elderly individuals with severe depression symptoms were at risk for malnutrition or malnourished. Among overweight individuals (according to the BMI), 18.5% were at risk for malnutrition /malnourished based in the MNA-SF (Table 2).
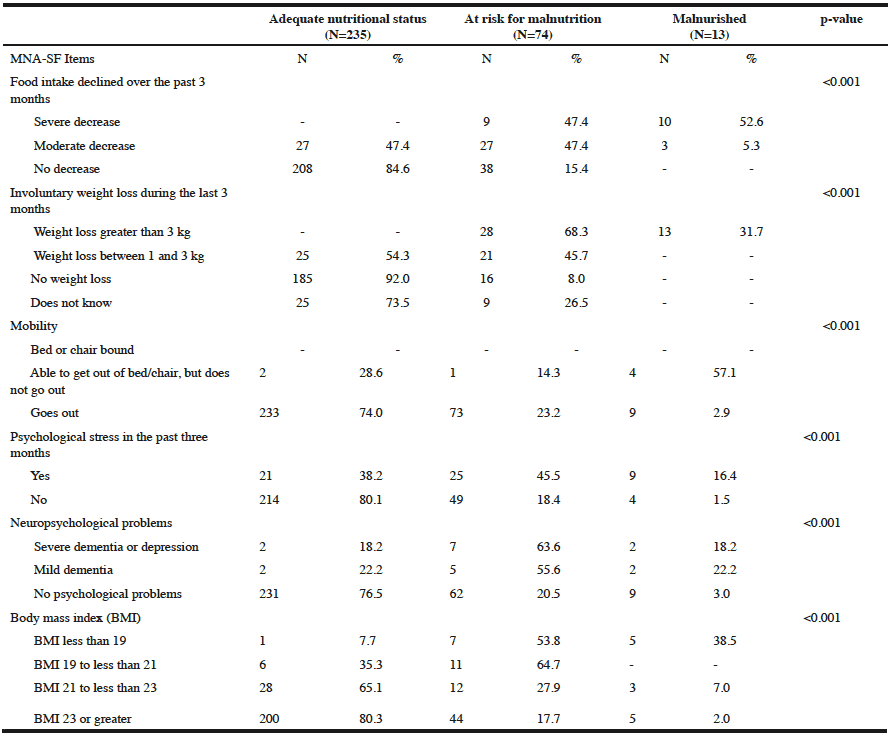
All individuals who reported a severe decrease in food intake were classified at risk for malnutrition or malnutrition categories of the MNA-SF, while no elder classified as malnourished was among those who did not report a decrease in food intake. Weight loss of more than 3 kg was reported only by patients classified by the MNA-SF as being at risk for malnutrition or malnourished. As for mobility, 26.1% of patients who walked were classified as being at risk for malnutrition/ malnourished. We also noted that 61.9% of the elderly individuals who reported being under psychological stress were classified as being at risk for malnutrition / malnourished. Most did not report neuropsychological problems. With respect to the item that assesses BMI, we noticed that among those who whose BMI was 23 or higher, almost 20% were classified in the categories at risk for malnutrition /malnutrition (Table 3).
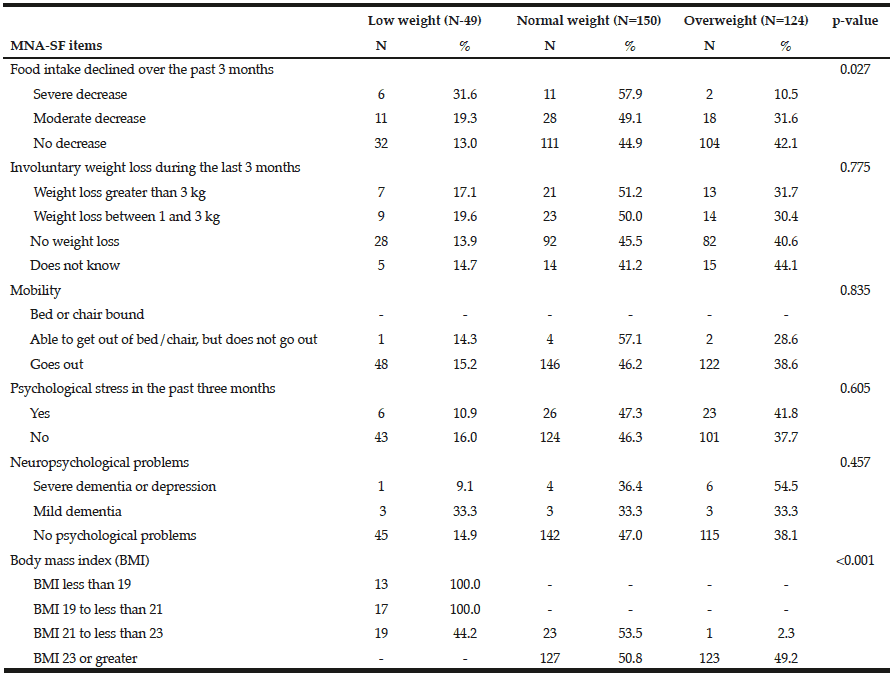
By comparing MNA-SF items with BMI according to Lipschitz, it was observed that with respect to food intake, of all 19 elderly individuals who reported a severe decrease, 57.9% were normal weight. We also noticed that among the individuals who had a BMI < 21 kg/m2, all were classified as low weight according to Lipschitz’s classification and elders with BMI values ≥ 23 kg/m2 were classified as normal weight and overweight. No statistically significant differences were found for the other items (Table 4).
Discussion
The MNA and the MNA-SF are specific tools to assess the nutritional status of elderly populations and have been used in studies with individuals in that age range living in the community (21, 22). Institutions such as the European Guidelines for Nutrition Screening (23) and the National Comprehensive Cancer Network (8) recommend their use for cancer patients.
The instrument was validated in elderly populations in several countries, which made it possible to visualize the effect of different body compositions and life habits (11). In addition to the fact that it is non-invasive and easy to apply, the greatest advantage of the MNA-SF is the identification of elderly individuals at nutritional risk before important weight changes could occur; it also provides an opportunity for offering some kind of nutritional intervention, which in turn reduces hospital admission costs and improves quality of life (24).
In this cross-sectional study, 87 (27.0%) of the individuals were classified as being at risk for malnutrition or malnourished, based on the MNA-SF. Another study conducted in France (25), used the same instrument to assess nutritional risk in more than 60 patients aged 65 or older who were undergoing treatment for advanced prostate cancer. Of those patients, 39 (65%) were at nutritional risk/malnourished. The high prevalence encountered by the French researchers could be explained by the fact that their study included patients undergoing treatment for cancer at advanced stages, while our study population included only individuals who had not yet initiated treatment.
In another study conducted in France (26), patients aged 70 or older who had different types of solid tumors, including prostate cancer were submitted to an MNA assessment to identify nutritional risk. Researchers found that 45.8% had an adequate nutritional status; 41.0% were at nutritional risk; and 13.2% were malnourished. They also assessed functional capacity in Basic Activities of Daily Living (ADL), which was measured by the Get- up-and-go test and depression measured by the Geriatric Depression Scale 15 (GDS-15). Among individuals whose nutritional status was adequate, 37.1% had an ADL dependence and 17.4% had depressive symptoms; among those classified under the nutritional risk category, 65.8% were dependents in ADL and 37.8% had depressive symptoms. Finally, among those classified as malnourished, 56.0% had an ADL-related dependence and all showed symptoms of depression. Those results are relatively similar to our findings, as we observed that all individuals classified with depressive symptoms were at risk for malnutrition/malnourished.
In the present study, all differences observed in terms of the distribution of nutritional status categories according to MNA-SF’ items were statistically significant, supporting the importance of each one of them within the instrument. In addition to the anthropometric item (BMI), other items related to nutrition (food intake and weight loss in three months) are relevant for elderly patients who diagnosed with cancer, since they can interfere with their treatment. In that sense, the use of the MNA-SF in the global health assessment of elderly individuals with cancer by the multidisciplinary team plays an important role, since it can contribute to the early identification and correction of nutritional problems.
Another relevant aspect of the MNA-SF consists of the inclusion of items that, although not related specifically to nutrition, such as mobility, psychological stress and neuropsychological problems, could have an impact on the nutritional status of the patients. Therefore, the MSN- SF offers an opportunity for multidisciplinary action when approaching elderly cancer patients.
MNA/MNA-SF are the most used nutritional assessment instruments in studies involving elderly individuals with cancer. However, other nutritional assessment methods, such as the BMI, the weight loss during treatment and biochemical tests were used in some studies (27-29). However, investigations that use weight loss for this evaluation may not be adequate for studies with elderly individuals, since they could have prior nutritional problems or even diet restrictions and therefore the assessment of this domain may not be accurate. On the other hand, the use of laboratory tests, such as albumin levels, would greatly increase investigation costs and lead to a decrease in the number of participants. Furthermore, concentrations of albumin can change due to factors unrelated to nutrition, such as inflammatory processes that occur in cancer patients (23).
The literature has shown that the BMI should be used carefully in the elderly population, since this index is more useful for excess weight (30). In addition, during the ageing process changes in the body such as a decrease in height, an increase of body fat and a decrease of lean body mass, which could influence the BMI, can occur (31), regardless of weight loss or constant weight. Even when using Lipschitz’s classification for BMI, which takes into account the ageing process, the resulting measure may not be able to reflect a nutritional risk process in its beginning (16).
Supporting this point, we observed in our study that 18.5% of the patients who were overweight according to the BMI classification were considered as being at risk for malnutrition/malnourished based on the MNA-SF. In the distribution of MNA-SF items according to Lipschitz’s BMI classification, we observed statistically significant differences for food intake and BMI, while other items had homogeneous distributions. It is worth noting that the cutoff points for BMI classification in the MNA-SF are different from those of the BMI according to Lipschitz.
This study has limitations, such as its cross-sectional design, which does not allow us to determine a timeline for the analyzed variables and the fact that MNA-SF answers are self-reported. This could have caused a possible information bias, even though trained and standardized interviewers applied the instrument.
On the other hand, it also has strong points, such as the significant number of patients included in the study and the originality of the discussed topic as it is the first in its kind conducted in Brazil. Also in the international literature about this subject there are few studies which used the MNA/MNA-SF to assess the nutritional status of elderly individuals with cancer.
In this study, MNA-SF proved to be an adequate tool to describe nutritional risk in elderly cancer patients. We should also note the good relationship between component items, their easy interpretation, the short period of time for its application and the good acceptance of the instrument by the elders.
Conflict of interest: Authors declare that there are no conflicts of interest in this study.
Financial support: PDTSP (Clinical Research Network in Public Health)/ Oswaldo Cruz Foundation and National Research Council (CNPq)
Ethical standards: Research project aproved by the Ethics Committee of the National School of Public Health / Oswaldo Cruz Foundation.
References
1. Lochs H, Allisonb SP, Meierc R, Pirlicha M, Kondrupd J, Schneidere ST, et al. Introductory to the ESPEN Guidelines on Enteral Nutrition: Terminology, Definitions and General Topics. Clin Nutr 2006;25:180–8.
2. Brunello A, Sandri R, Extermann M. Multidimensional geriatric evaluation for older cancer patients as a clinical and research tool. Cancer Treat Rev 2009;35:487-492.
3. Duval PA, Vargas BL, Fripp JC, Arrieira ICO, Lazzeri B, Destri K. Caquexia em Pacientes Oncológicos Internados em um Programa de Internação Domiciliar Interdisciplinar. Rev Bras Cancerol 2010;56(2):207-212.
4. Aaldriks AA, Maartense E, Cessie SLE, Giltay EJ, Verlaan, HACM, Geest LG, et al. Predictive value of geriatric assessment for patients older than 70 years, treated with chemotherapy. Crit Rev Oncol Hematol 2011;79:205–212.
5. Extermann M, Wedding U. Comorbidity and geriatric assessment for older patients with hematologic malignancies: A review of the evidence. J Geriatric Oncol 2012;(3):49-57.
6. Bozzetti F. Nutritional aspects of the cancer/aging interface. J Geriatric Oncol 2011;2:177-186.
7. Valentiny C, Kemmler G, Stauder R. Age, sex and gender impact multidimensional geriatric. J Geriatric Oncol 2012;3:17-23.
8. Lichtman SM. Guidelines for the treatment of elderly cancer patients. Cancer Control 2003;10(6):445-453.
9. Balducci L. Assessment and treatment of elderly patients with cancer. Surg Oncol 2010;19:117-123.
10. Puts MTE, Hardt J, Monette J, Girre V, Springall E, Alibhai SMH. Use of Geriatric Assessment for Older Adults in the Oncology Setting: A Systematic Review. JNCI 2012:1-31,
11. Rubenstein LZ, Harker JO, Salvà A, Guigoz Y, Vellas B. Screening for undernutrition in Geriatric Practice: Developing the Short-Form Mini- Nutritional Assessment (MNA SF). J Gerontol: MEDICAL SCIENCES 2001;56A(6):M366-M372.
12. Guigoz Y. The mini nutritional assessment (MNA®) Review of the literature – what does it tell us? J Nutr Health Aging 2006;10(6):466-485.
13. Sieber CC. Nutritional screening tools – how does the mna® compare? J Nutr Health Aging 2006;10(6):488-494.
14. Delacorte RR, Moriguti JC, Matos FD, Pfrimer K, Marchinil JS, Ferriolli E. Mini-nutritional assessment score and the risk for undernutrition in free- living older persons. J Nutr Health Aging 2004;8(6):531-4.
15. Ferreira LS, Nascimento LF, Marucci MF. Use of the mini nutritional assessment tool in elderly people from long-term institutions of southeast of Brazil. J Nutr Health Aging 2008 Mar;12(3):213-7.
16. Lipschitz DA. Screening for nutritional status in the elderly. Prim Care 1994;21(1):55-67.
17. Ministério da Saúde. Instituto Nacional de Câncer José Alencar Gomes da Silva. Programa nacional de controle do câncer da próstata: documento de consenso, 2002.
18. Katz S, Ford AB, Moskowitz RW, Jackson BA, Jaffe MW. Studies of illness in the aged. The index of ADL: a standardized measure of biological and psychosocial function. JAMA 1963;185(12):914-9.
19. Miller MD, Paradis CF, Houck PR, Mazumdar S, Stack JA, Rifai AH, et al. Rating chronic medical illness burden in geropsychiatric practice and research: Application of the Cumulative Illness Rating Scale. J Psych Res 1992;41:237-248.
20. Yesavage JA, Brink TL, Rose TL, Lum O, Huang V, Adey M, et al. Development and validation of a geriatric depression screening scale: A preliminary report. J Psych Res 1982;17(1):37-49.
21. Power SE, Jeffery IB, Ross RP, Stanton C, O’Toole PW, O’Connor EM, et al. Food and nutrient intake of Irish community-dwelling elderly subjects: Who is ate nutritional risk? J Nutr Health Aging 2014;18(6):561-572.
22. Rodrigues RAS, Espinosa MM, Melo CD, Perracini MR, Fett WCR, Fett CA. New values anthropometry for classification of nutritional status in the elderly. J Nutr Health Aging 2014;18(6):655-661.
23. Bouillanne O, Hay P, Liabaud B, Duche C, Cynober L, Aussel C. Evidence that albumin is not a suitable marker of body composition-related nutritional status in elderly patients. Nutr 2011;27:165–169.
24. Guigoz Y, Lauque S, Vellas BJ. Identifying the elderly at risk for malnutrition The Mini Nutritional Assessment. Clin Geriatr Med 2002;18:737– 757.
25. Terret C, Albrand G, Droz J-P. Geriatric assessment in elderly patients with prostate cancer.Clin Prostate Cancer 2004;2(4):236-240.
26. Paillaud E, Liuu E, Laurent M, Le Thuaut A, Vincent H, Raynaud-Simon A, et al. Geriatric syndromes increased the nutritional risk in elderly cancer patients independently from tumoursite and metastatic status. The ELCAPA-05 cohort study. Clin Nutr 2014:33:330-335.
27. Lescut N, Personeni E, Desmarets M, Puyraveau M, Hamlaoui R, Servagi-Vernat S, et al. Évaluation d’un score prédictif de dénutrition chez les patients pris en charge par irradiation pour un cancer des voies aérodigestives supérieures: étude rétrospective chez 127 patients. Cancer/ Radiothérapie 2013;17:649–655.
28. Kanesvaran R, Wang W, Yang Y, Wei Z, Jia L, Li F, et al. Characteristics and treatment options of elderly Chinese patients with cancer as determined by Comprehensive Geriatric Assessment (CGA). J Geriatric Oncol 2014;(5):171-8.
29. Lazarovici C, Khodabakhshi R, Leignel D, Fabre-Guillevin E, Minard A.; Gisselbrecht M. Factors leading oncologists to refer elderly cancer patients for geriatric assessment. J Geriatric Oncol 2011;(2):194-199.
30. Cervi A, Franceschini SCC, Priore SE. Análise crítica do uso do índice de massa corporal para idosos. Rev Nutr 2005;18(6):&65-775.
31. Sampaio LR. Avaliação nutricional e envelhecimento. Rev Nut 2004 Out- Dec;17(4):507-514.


